The following data shows the yearly income distribution of a
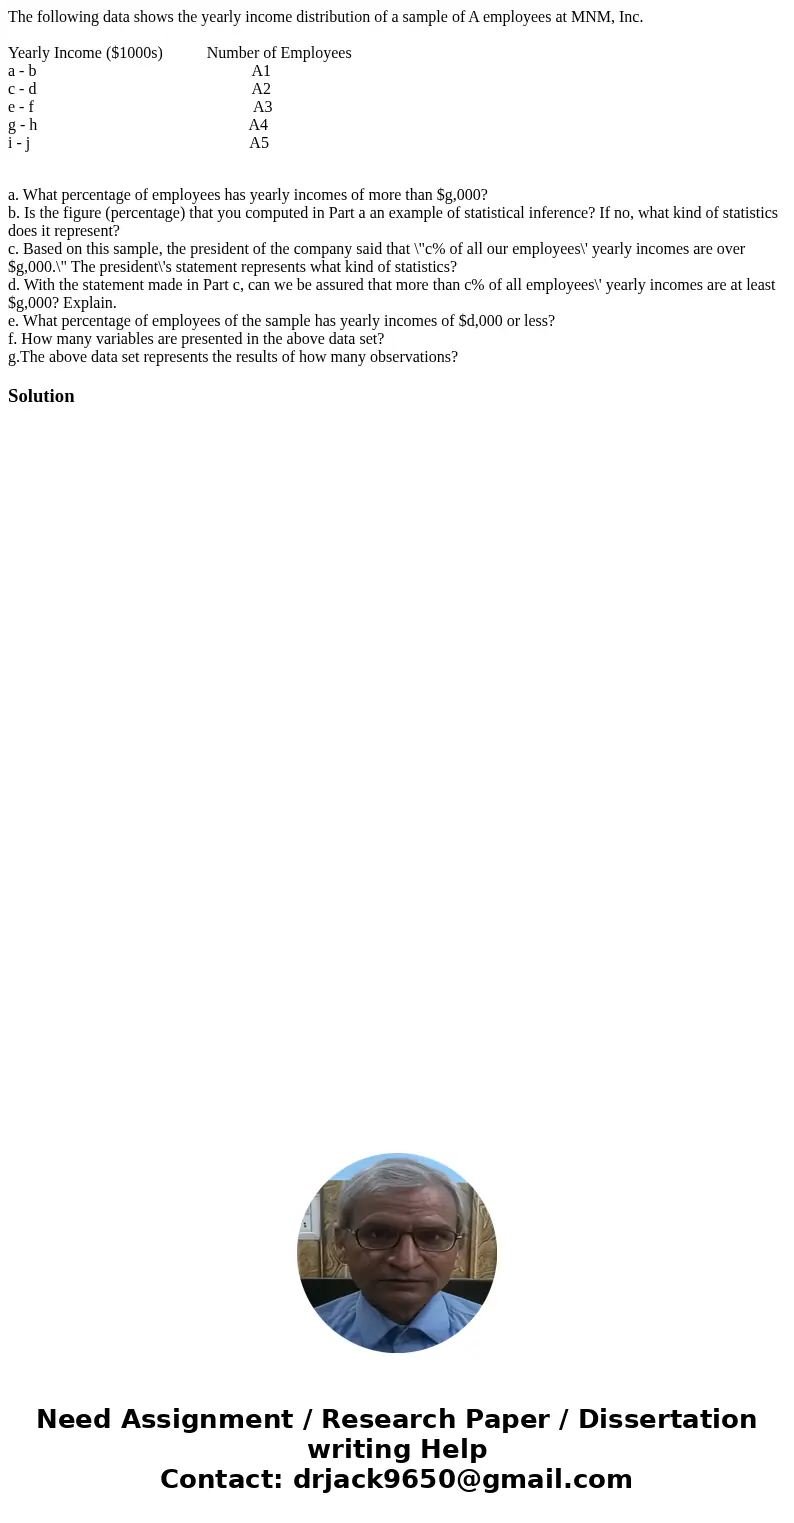
The following data shows the yearly income distribution of a sample of A employees at MNM, Inc.
Yearly Income ($1000s) Number of Employees
a - b A1
c - d A2
e - f A3
g - h A4
i - j A5
a. What percentage of employees has yearly incomes of more than $g,000?
b. Is the figure (percentage) that you computed in Part a an example of statistical inference? If no, what kind of statistics does it represent?
c. Based on this sample, the president of the company said that \"c% of all our employees\' yearly incomes are over $g,000.\" The president\'s statement represents what kind of statistics?
d. With the statement made in Part c, can we be assured that more than c% of all employees\' yearly incomes are at least $g,000? Explain.
e. What percentage of employees of the sample has yearly incomes of $d,000 or less?
f. How many variables are presented in the above data set?
g.The above data set represents the results of how many observations?
Solution

 Homework Sourse