Shown below is a portion of a computer output for regression
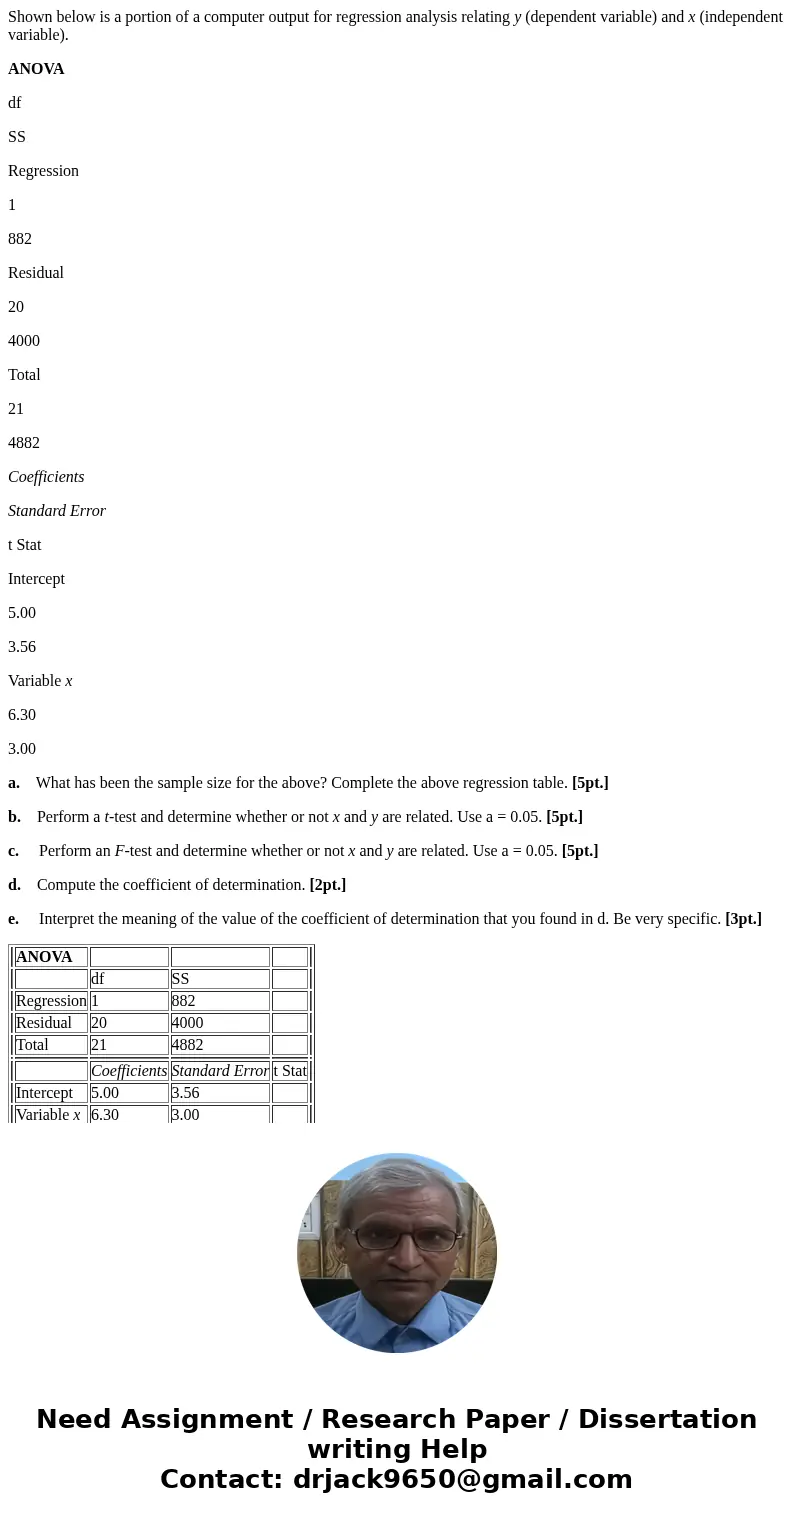
Shown below is a portion of a computer output for regression analysis relating y (dependent variable) and x (independent variable).
ANOVA
df
SS
Regression
1
882
Residual
20
4000
Total
21
4882
Coefficients
Standard Error
t Stat
Intercept
5.00
3.56
Variable x
6.30
3.00
a. What has been the sample size for the above? Complete the above regression table. [5pt.]
b. Perform a t-test and determine whether or not x and y are related. Use a = 0.05. [5pt.]
c. Perform an F-test and determine whether or not x and y are related. Use a = 0.05. [5pt.]
d. Compute the coefficient of determination. [2pt.]
e. Interpret the meaning of the value of the coefficient of determination that you found in d. Be very specific. [3pt.]
| ANOVA | |||||
| df | SS | ||||
| Regression | 1 | 882 | |||
| Residual | 20 | 4000 | |||
| Total | 21 | 4882 | |||
| Coefficients | Standard Error | t Stat | |||
| Intercept | 5.00 | 3.56 | |||
| Variable x | 6.30 | 3.00 |
Solution
A.
Note that
N = df(tot) + 1 = 22
***************************
B.
As
t = B1/sB1
and
B1 = 6.30
sB1 = 3.00
Then
t = 2.1
As there are 22 data points, the df of this t test is
df = n - 2 = 20
Thus, using technology to get the p value,
p = 0.048617587
As p < 0.05, then there is significant evidence that THEY ARE RELATED.
*******************************
c.
As
F = [SS(reg) df(res)] / [SS(res) df(reg)]
Thus,
F = 4.41
Using technology to get the p value, as df1 = 1, df2 = 20,
P = 0.048617587
As p < 0.05, then there is significant evidence that THEY ARE RELATED.
*****************************************
D.
As
t = r sqrt[(n - 2)/(1 - r^2)]
and t = 2.1, n = 22, then solving for r^2,
r^2 = 0.09502 [ANSWER]
***************************************
E.
It means that 0.09502 of the total variation is explained by the dependence of y to the independent variable, x. This is the interpretation of r^2, by definition.


 Homework Sourse