The following frequency distribution shows the GMAT scores o
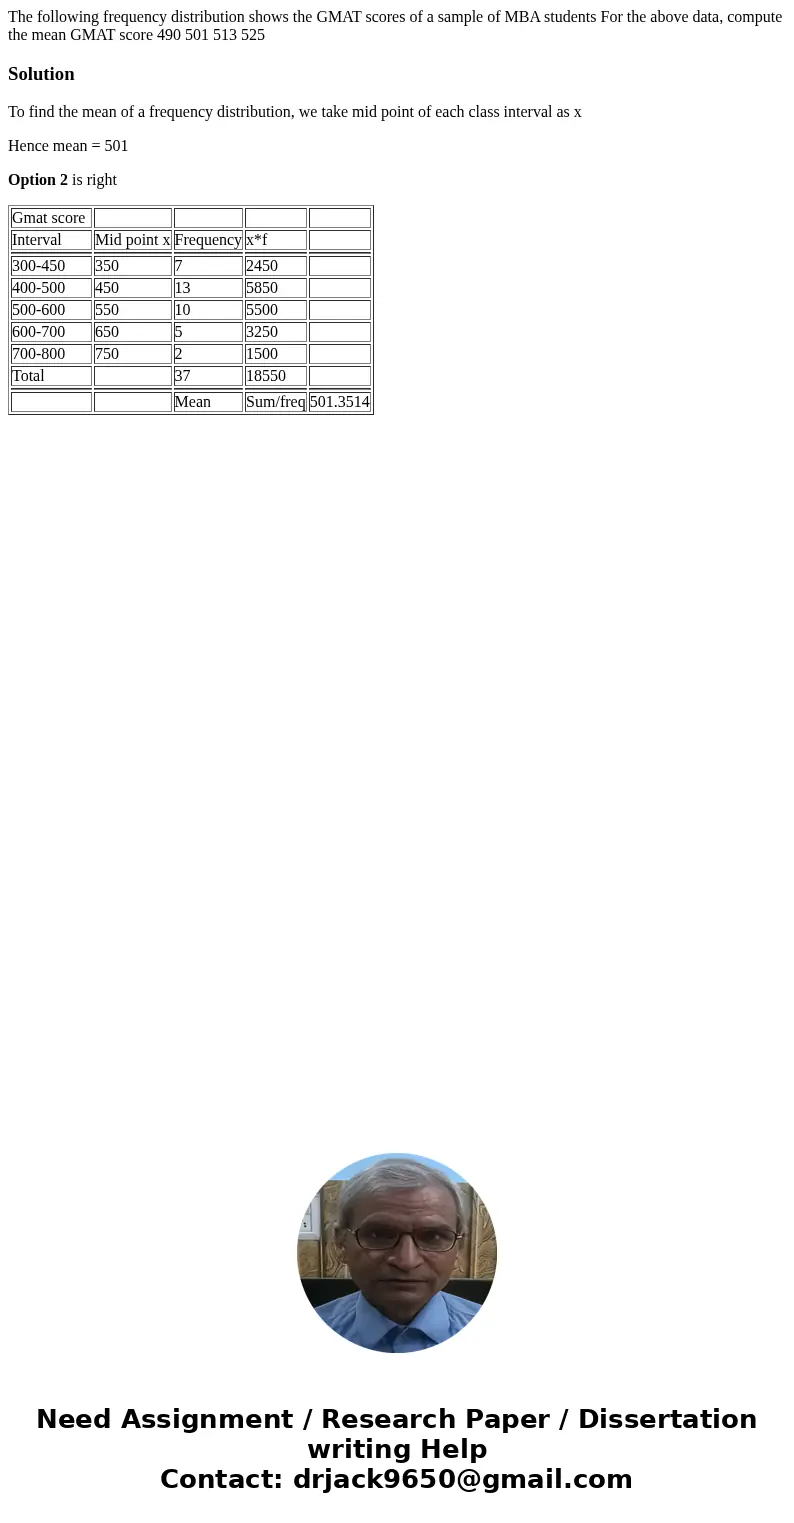
The following frequency distribution shows the GMAT scores of a sample of MBA students For the above data, compute the mean GMAT score 490 501 513 525

Solution
To find the mean of a frequency distribution, we take mid point of each class interval as x
Hence mean = 501
Option 2 is right
| Gmat score | ||||
| Interval | Mid point x | Frequency | x*f | |
| 300-450 | 350 | 7 | 2450 | |
| 400-500 | 450 | 13 | 5850 | |
| 500-600 | 550 | 10 | 5500 | |
| 600-700 | 650 | 5 | 3250 | |
| 700-800 | 750 | 2 | 1500 | |
| Total | 37 | 18550 | ||
| Mean | Sum/freq | 501.3514 |

 Homework Sourse