Consider the estimates below Amount of coverage and househol
Consider the estimates below:
Amount of coverage and household income - continuous variables
Retired (0 - No, 1 - Yes) and Marital Status (0 - Single; 1 - Married) - dichotomous varaibles
.410
a. Dependent Variable: Cost of claim
What demographics insurance company target in order to maximize profitability?
Married AND retired people
Single and retired people
Married people
Retired people
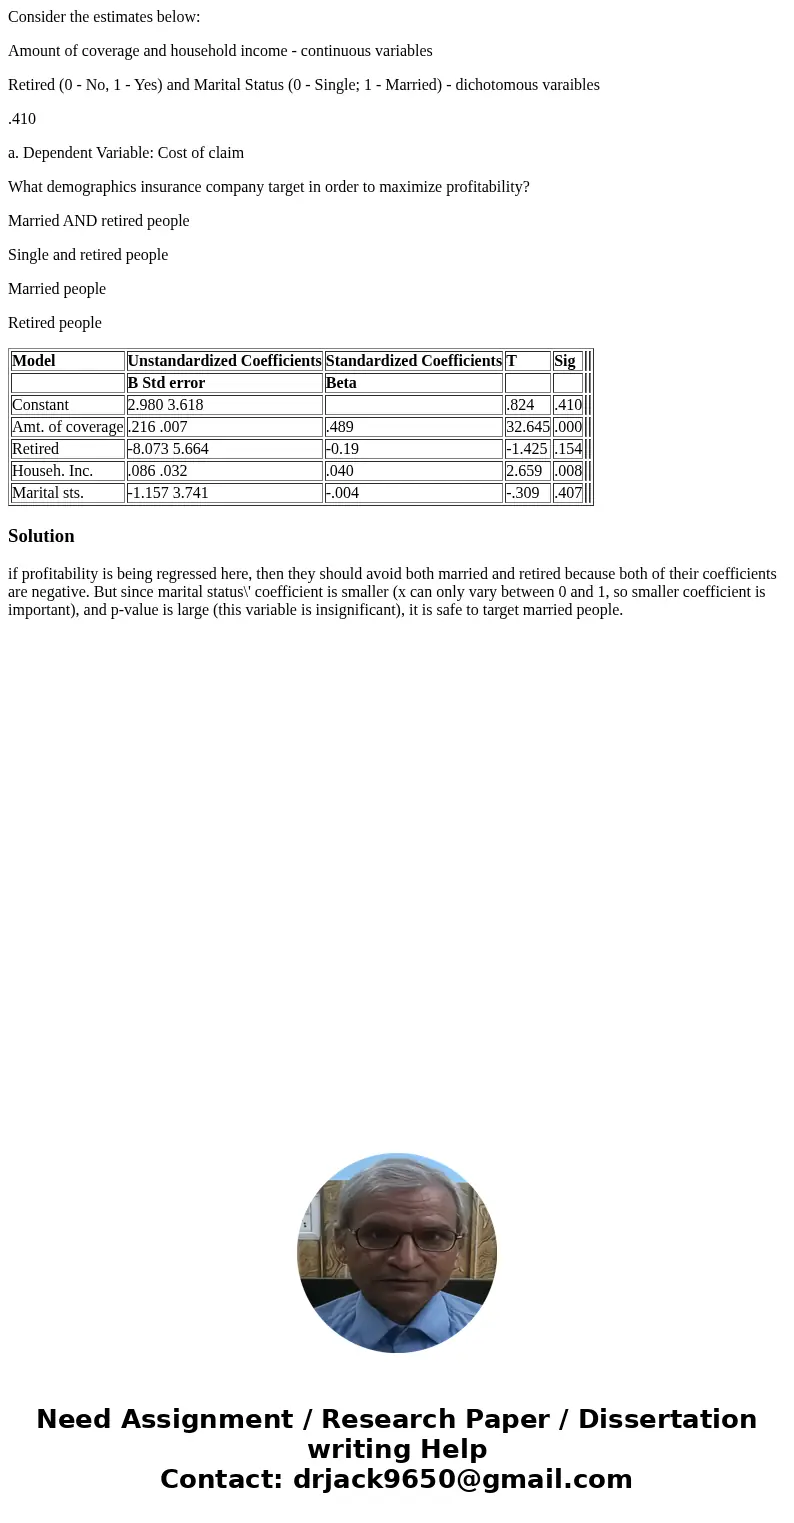
| Model | Unstandardized Coefficients | Standardized Coefficients | T | Sig | ||
| B Std error | Beta | |||||
| Constant | 2.980 3.618 | .824 | .410 | |||
| Amt. of coverage | .216 .007 | .489 | 32.645 | .000 | ||
| Retired | -8.073 5.664 | -0.19 | -1.425 | .154 | ||
| Househ. Inc. | .086 .032 | .040 | 2.659 | .008 | ||
| Marital sts. | -1.157 3.741 | -.004 | -.309 | .407 |
Solution
if profitability is being regressed here, then they should avoid both married and retired because both of their coefficients are negative. But since marital status\' coefficient is smaller (x can only vary between 0 and 1, so smaller coefficient is important), and p-value is large (this variable is insignificant), it is safe to target married people.

 Homework Sourse