For the following group data calculate a ttest and test for
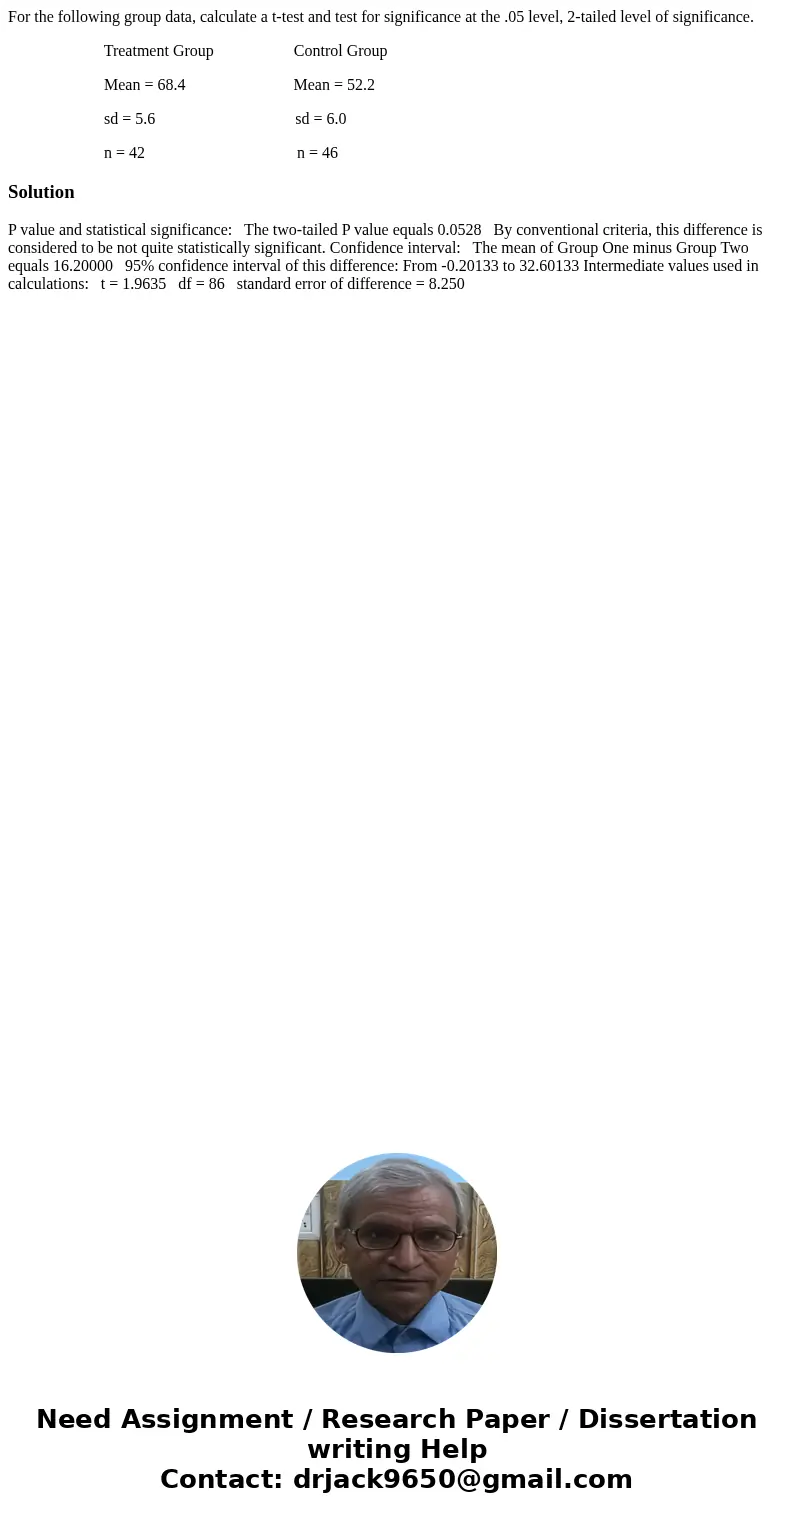
For the following group data, calculate a t-test and test for significance at the .05 level, 2-tailed level of significance.
Treatment Group Control Group
Mean = 68.4 Mean = 52.2
sd = 5.6 sd = 6.0
n = 42 n = 46
Solution
P value and statistical significance: The two-tailed P value equals 0.0528 By conventional criteria, this difference is considered to be not quite statistically significant. Confidence interval: The mean of Group One minus Group Two equals 16.20000 95% confidence interval of this difference: From -0.20133 to 32.60133 Intermediate values used in calculations: t = 1.9635 df = 86 standard error of difference = 8.250
 Homework Sourse