Listed are 20082009 cost of outofstate undergraduate tuition
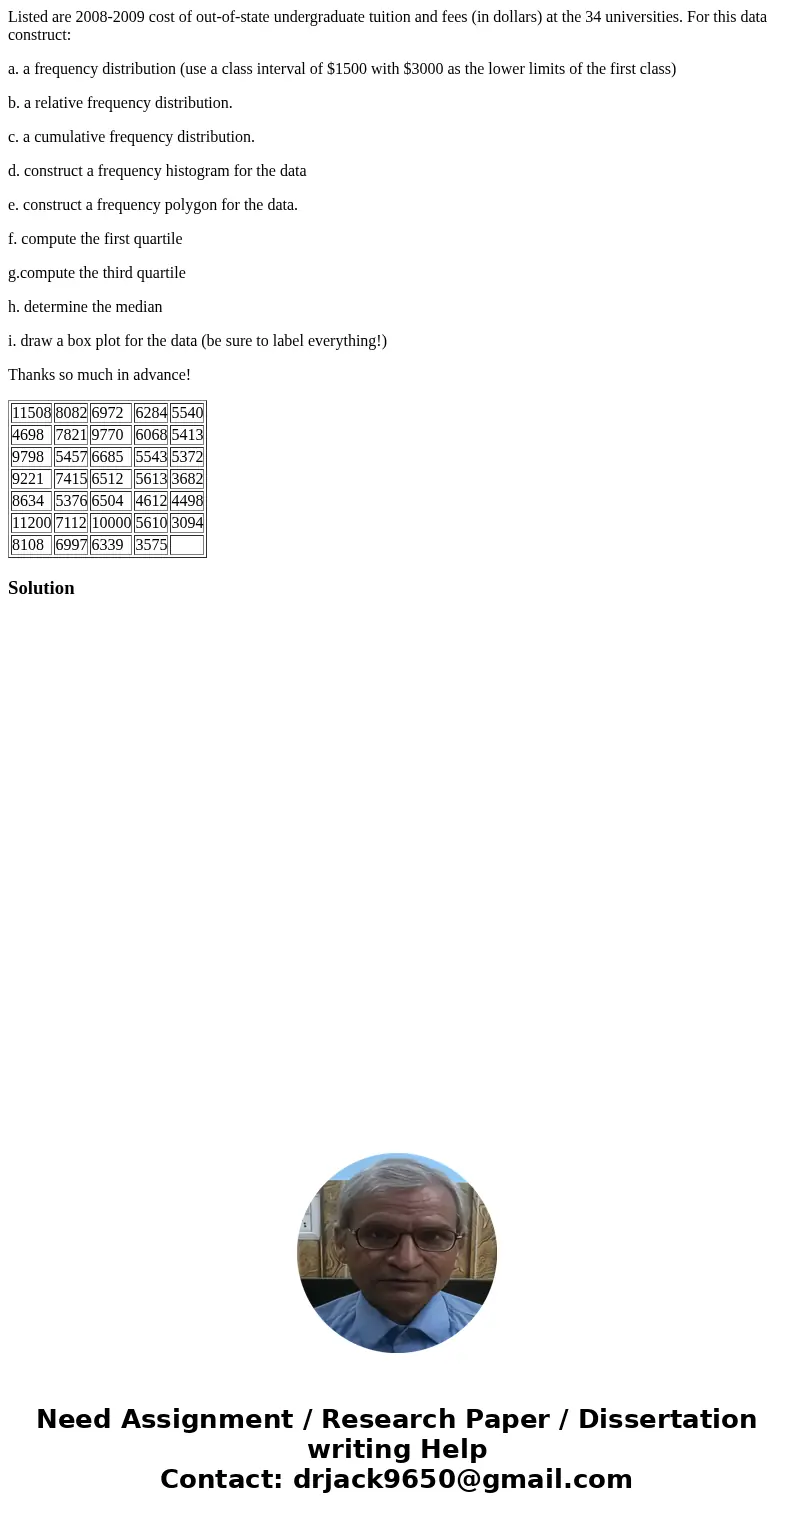
Listed are 2008-2009 cost of out-of-state undergraduate tuition and fees (in dollars) at the 34 universities. For this data construct:
a. a frequency distribution (use a class interval of $1500 with $3000 as the lower limits of the first class)
b. a relative frequency distribution.
c. a cumulative frequency distribution.
d. construct a frequency histogram for the data
e. construct a frequency polygon for the data.
f. compute the first quartile
g.compute the third quartile
h. determine the median
i. draw a box plot for the data (be sure to label everything!)
Thanks so much in advance!
| 11508 | 8082 | 6972 | 6284 | 5540 |
| 4698 | 7821 | 9770 | 6068 | 5413 |
| 9798 | 5457 | 6685 | 5543 | 5372 |
| 9221 | 7415 | 6512 | 5613 | 3682 |
| 8634 | 5376 | 6504 | 4612 | 4498 |
| 11200 | 7112 | 10000 | 5610 | 3094 |
| 8108 | 6997 | 6339 | 3575 |
Solution

 Homework Sourse