1 Which of the following is a meaningful reason in order to
1. Which of the following is a meaningful reason in order to eliminate an outlier from a dataset?
A. The outlier shows the variability of the dataset.
B. The outlier does not belong to the dataset.
C. The outlier is greater than the standard deviation.
D. The outlier has a negative value.
Which of following statement is true about an outlier in a dataset?
The outlier is an observation that shows a normal behavior in a population.
An extreme outlier is a point that may lie in the control limits.
The outlier gives useful information about the process examined.
The outlier does not indicate an error.
A regression line of the final exam grade, y, and midterm exam grade, x, is presented as:
Regarding to the equation above, which of following statement interprets the slope?
A. A student who gets 50 points from the midterm would be assumed to score 75 points on the final exam.
B. A student who gets 4 points greater than another student on the midterm would be assumed to get 1 point greater than that student on the final exam.
C. A student who gets 100 points from the midterm would be assumed to score 100 points on the final exam.
D. None of the above
4. A sample of 400 metal hardness values selected from a dataset, where the sample is normally distributed with mean 120 and standard deviation 10. According to the given information, which interval is more likely to include over 99% of the metal hardness values in the sample?
A. 119 to 121
B. 110 to 130
C. 100 to 140
D. 90 to 150
5. An article studied on Vitamin C indicates that Vitamin C decreases the risk of getting cold. Thereupon, a researcher comes up with an idea by saying that Vitamin C tends to show better results in an experiment comparing to a placebo, however, the difference is not significantly larger than what can be described by chance. Which of the following refers to the researcher’s statement?
A. The results are due to non-sampling errors.
B. The results are totally due to chance.
C. The results are statistically significant.
D. The results are statistically insignificant.
6. Which of the following statement is true about the standard deviation () of in a sample size n?
A. when n increases, increases
B. when n increases, decreases
C. when n increases, does not change
D. is an estimation of the standard error of
7. The frequency distribution table for the incomes of part-time employees is given as:
Income ($)
Frequency
700-800
56
801-900
64
901-1000
87
1001-1100
79
1101
50
Regarding to the table above, which of the following represents the relative frequency distribution table?
Income ($)
Relative Frequency
700-800
56
801-900
120
901-1000
207
1001-1100
286
1101
336
Income ($)
Relative Frequency
700-800
16.67%
801-900
35.71%
901-1000
61.61%
1001-1100
85.12%
1101
100.00%
Income ($)
Relative Frequency
700-800
0.1667
801-900
0.1905
901-1000
0.2589
1001-1100
0.2351
1101
0.1488
Income ($)
Relative Frequency
700-800
17.49%
801-900
18.26%
901-1000
26.75%
1001-1100
20.54%
1101
13.98%
8. The data given below represents the weights of randomly selected women and men.
Women:
130
126
175
180
142
120
158
164
135
152
147
112
102
127
118
Men:
153
166
178
180
199
146
136
165
162
176
201
190
187
159
171
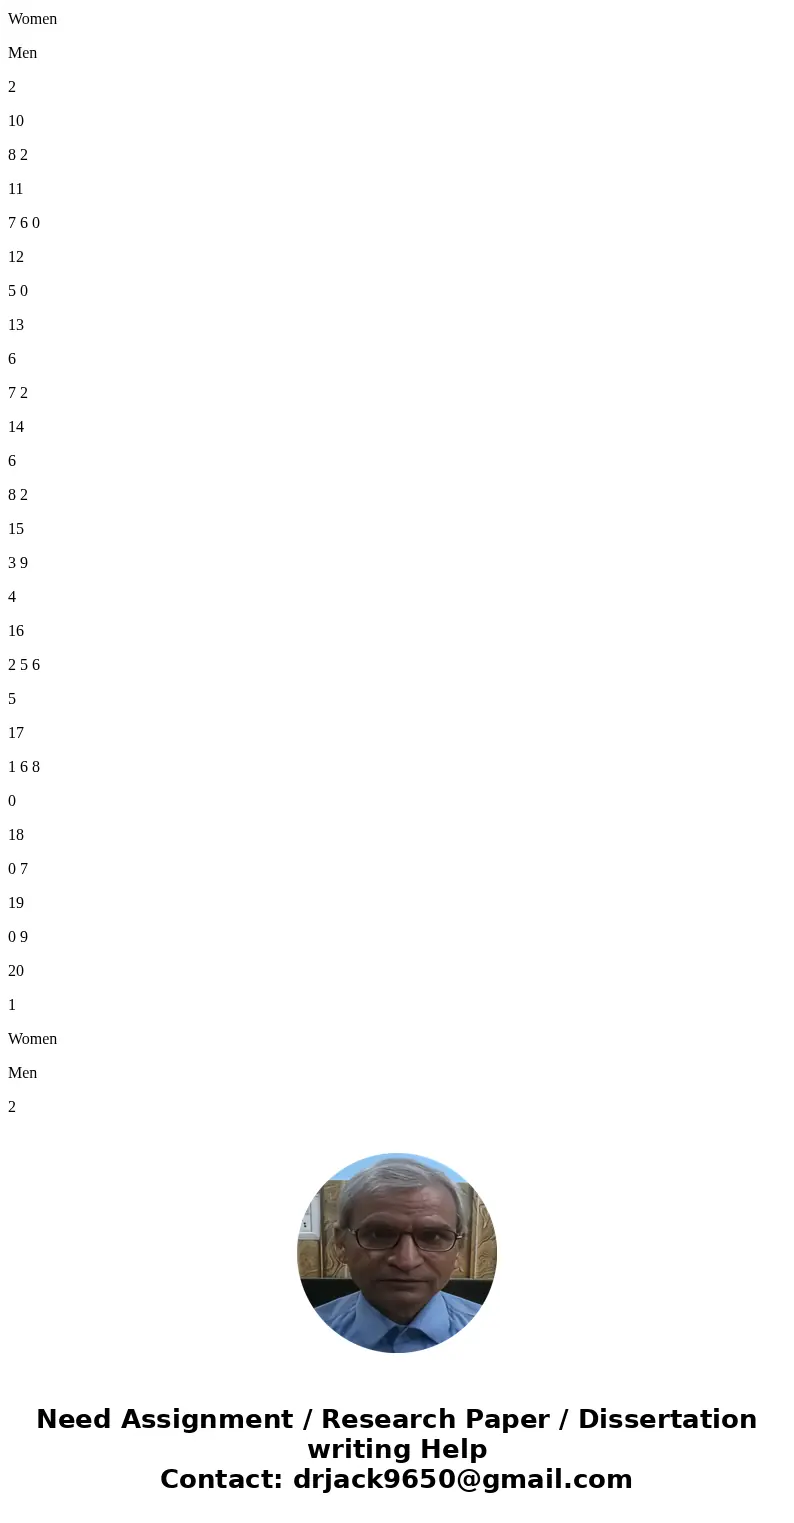
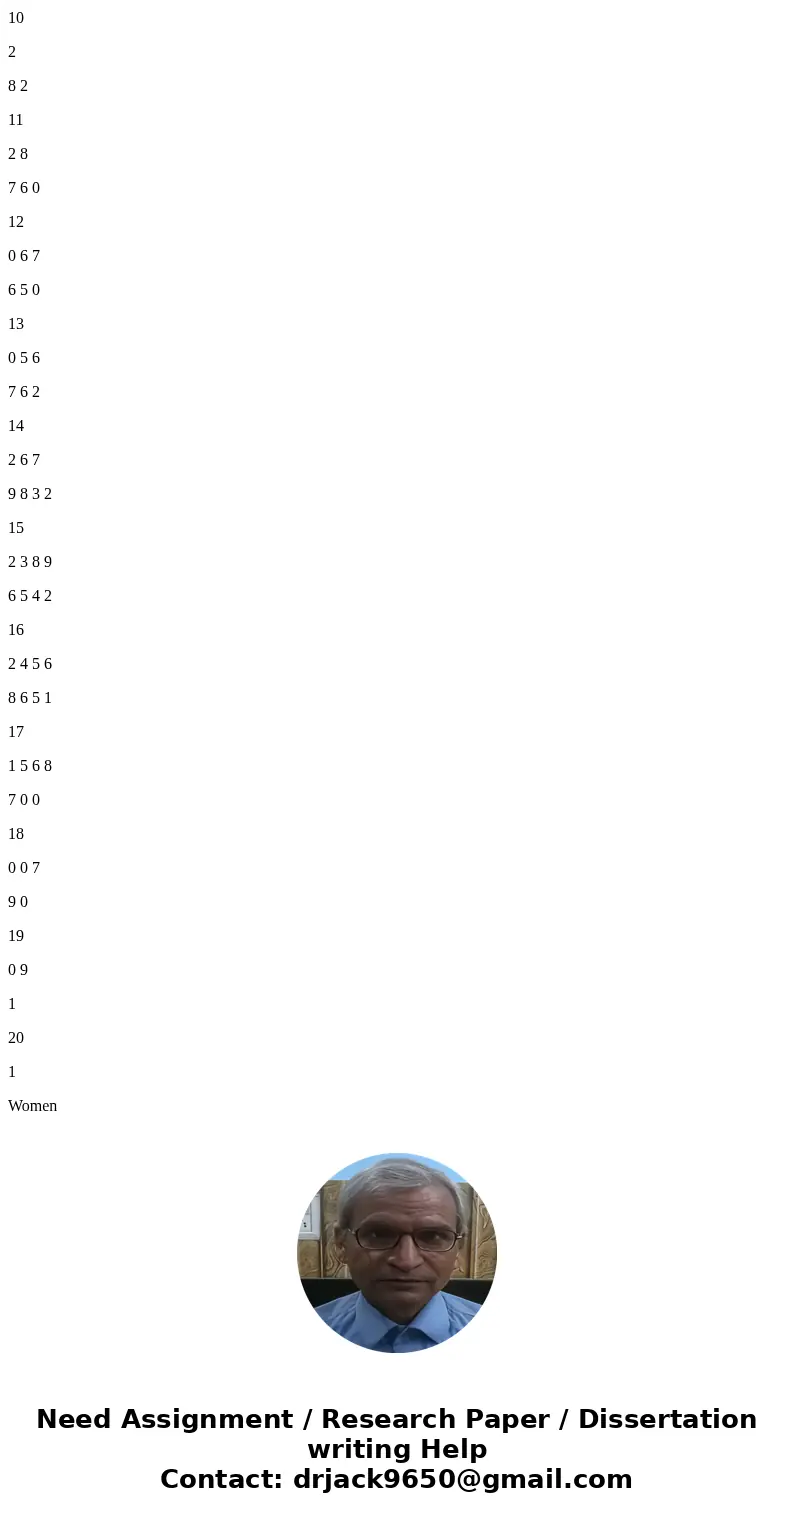
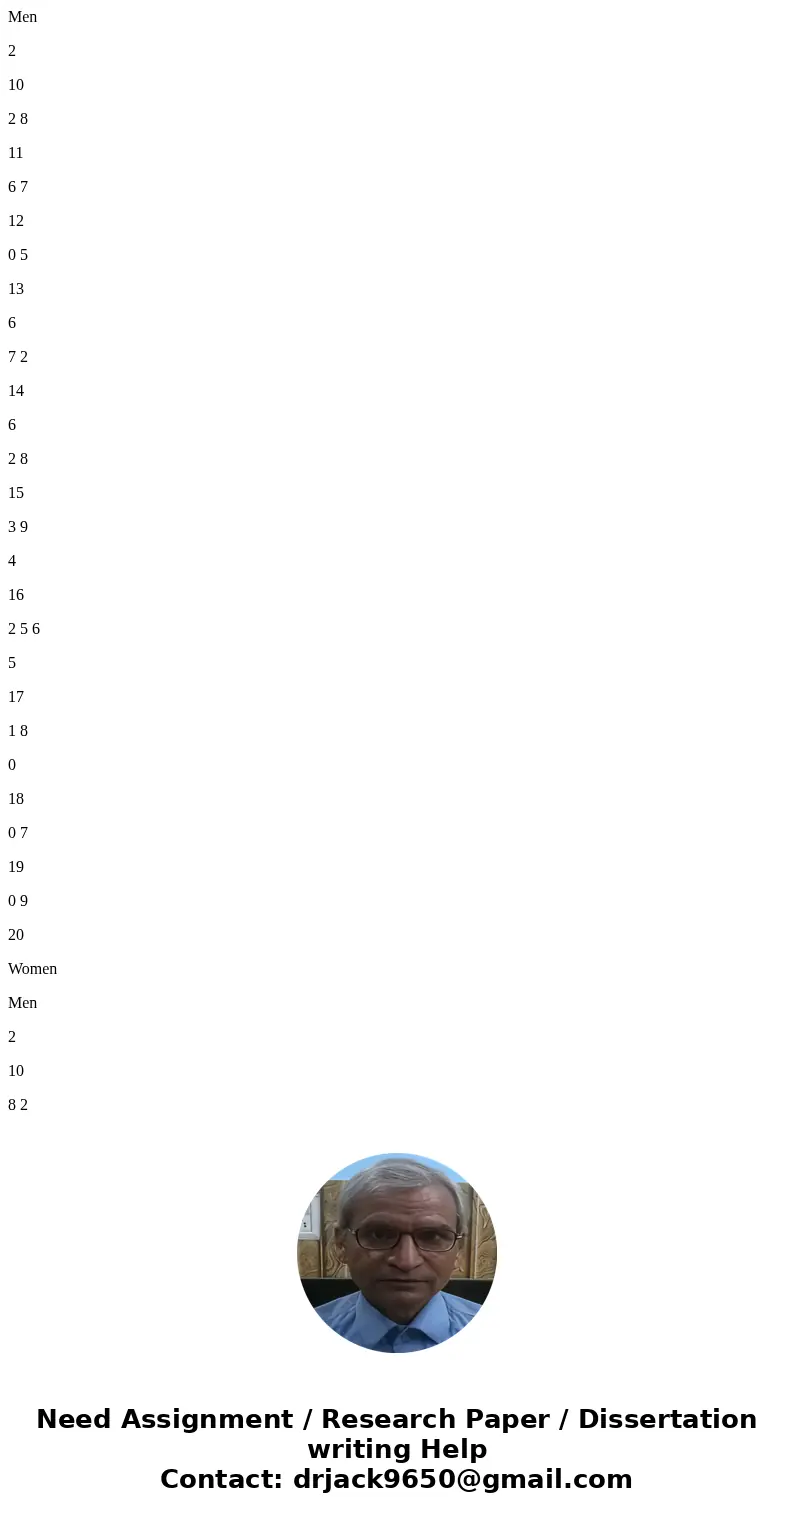
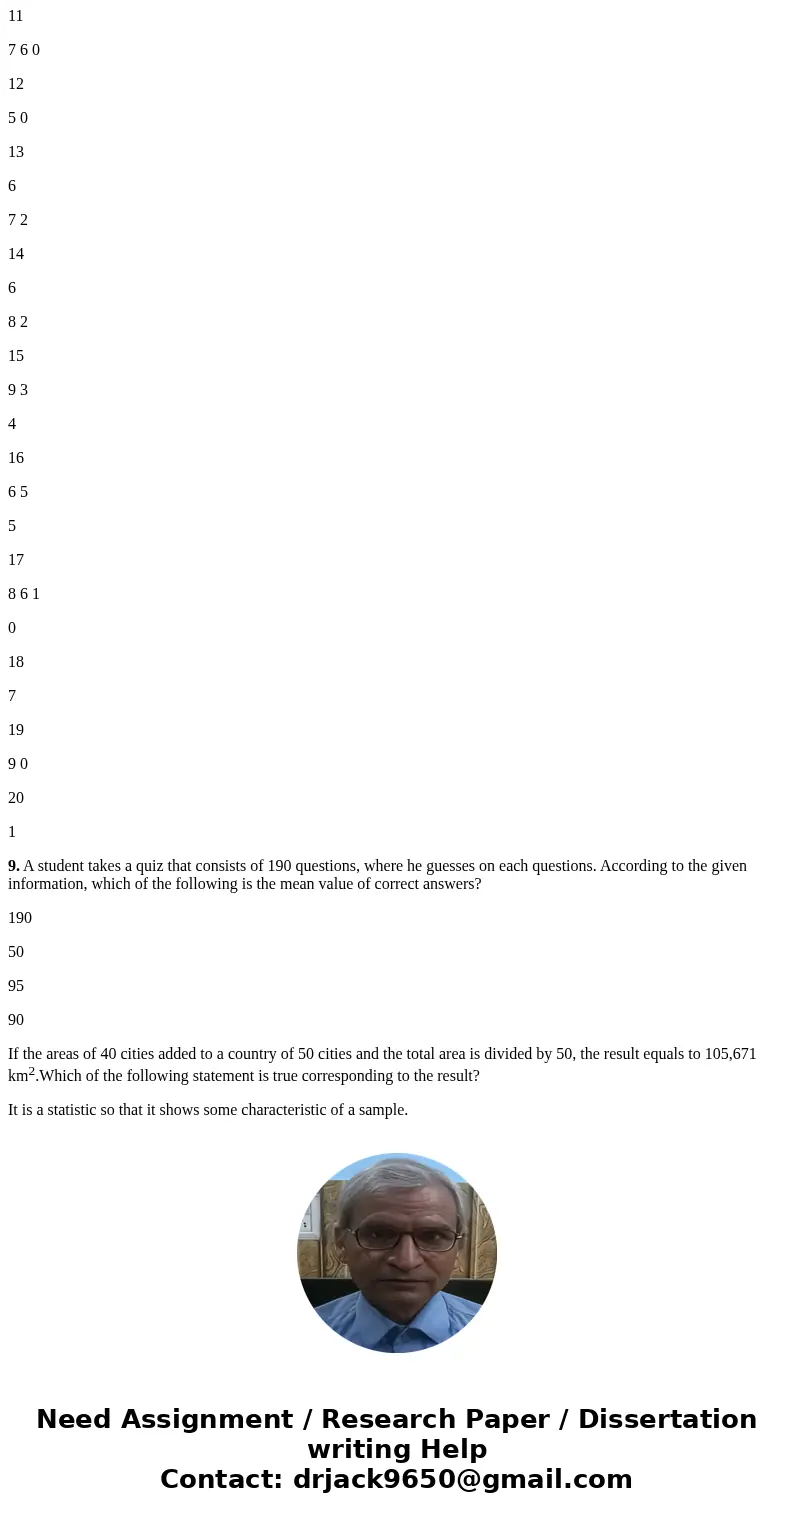
Which of following shows the stem-and-plot diagram of the data above?
Women
Men
2
10
8 2
11
7 6 0
12
5 0
13
6
7 2
14
6
8 2
15
3 9
4
16
2 5 6
5
17
1 6 8
0
18
0 7
19
0 9
20
1
Women
Men
2
10
2
8 2
11
2 8
7 6 0
12
0 6 7
6 5 0
13
0 5 6
7 6 2
14
2 6 7
9 8 3 2
15
2 3 8 9
6 5 4 2
16
2 4 5 6
8 6 5 1
17
1 5 6 8
7 0 0
18
0 0 7
9 0
19
0 9
1
20
1
Women
Men
2
10
2 8
11
6 7
12
0 5
13
6
7 2
14
6
2 8
15
3 9
4
16
2 5 6
5
17
1 8
0
18
0 7
19
0 9
20
Women
Men
2
10
8 2
11
7 6 0
12
5 0
13
6
7 2
14
6
8 2
15
9 3
4
16
6 5
5
17
8 6 1
0
18
7
19
9 0
20
1
9. A student takes a quiz that consists of 190 questions, where he guesses on each questions. According to the given information, which of the following is the mean value of correct answers?
190
50
95
90
If the areas of 40 cities added to a country of 50 cities and the total area is divided by 50, the result equals to 105,671 km2.Which of the following statement is true corresponding to the result?
It is a statistic so that it shows some characteristic of a sample.
It is a parameter so that it shows some characteristic of a sample.
It is a statistic so that it shows some characteristic of a population.
It is a parameter so that it shows some characteristic of a sample.
11. A survey was conducted among 250 casino goers in order to depict the gaming practices of the group. According to the survey, the collected data is represented in the following chart:
Which of the following chart shows the relative frequency of the collected data?
Answer the following 2 questions relating to the given table below.
The table of observed frequencies within the class intervals is given as follows:
Class Interval
Frequency
300-349
2
350-399
3
400-449
7
450-499
10
500-549
13
550-599
20
600-649
15
650-699
3
12. Which of the following is the correct histogram?
13. Does the result appear to be a normal distribution?
No, because the histogram is uniform.
No, because the histogram is not symmetric.
Yes, the histogram is normal.
No, because histogram has no obvious maximum.
| Income ($) | Frequency |
| 700-800 | 56 |
| 801-900 | 64 |
| 901-1000 | 87 |
| 1001-1100 | 79 |
| 1101 | 50 |
Solution
1. Which of the following is a meaningful reason in order to eliminate an outlier from a dataset?
B. The outlier does not belong to the dataset.
2.
Which of following statement is true about an outlier in a dataset?
The outlier does not indicate an error.
********************
For #3, the equation of the line did not show up.
***********************
4. A sample of 400 metal hardness values selected from a dataset, where the sample is normally distributed with mean 120 and standard deviation 10. According to the given information, which interval is more likely to include over 99% of the metal hardness values in the sample?
By empirical rule, it si within 3 standard deviations from the mean,
D. 90 to 150 [ANSWER]
*******************************************
Hi! Please submit the next part as a separate question. That way we can continue helping you! Please indicate which parts are not yet solved when you submit. Thanks!
 Homework Sourse