4 Starting with your estimate of net sales for fiscal 1995 e
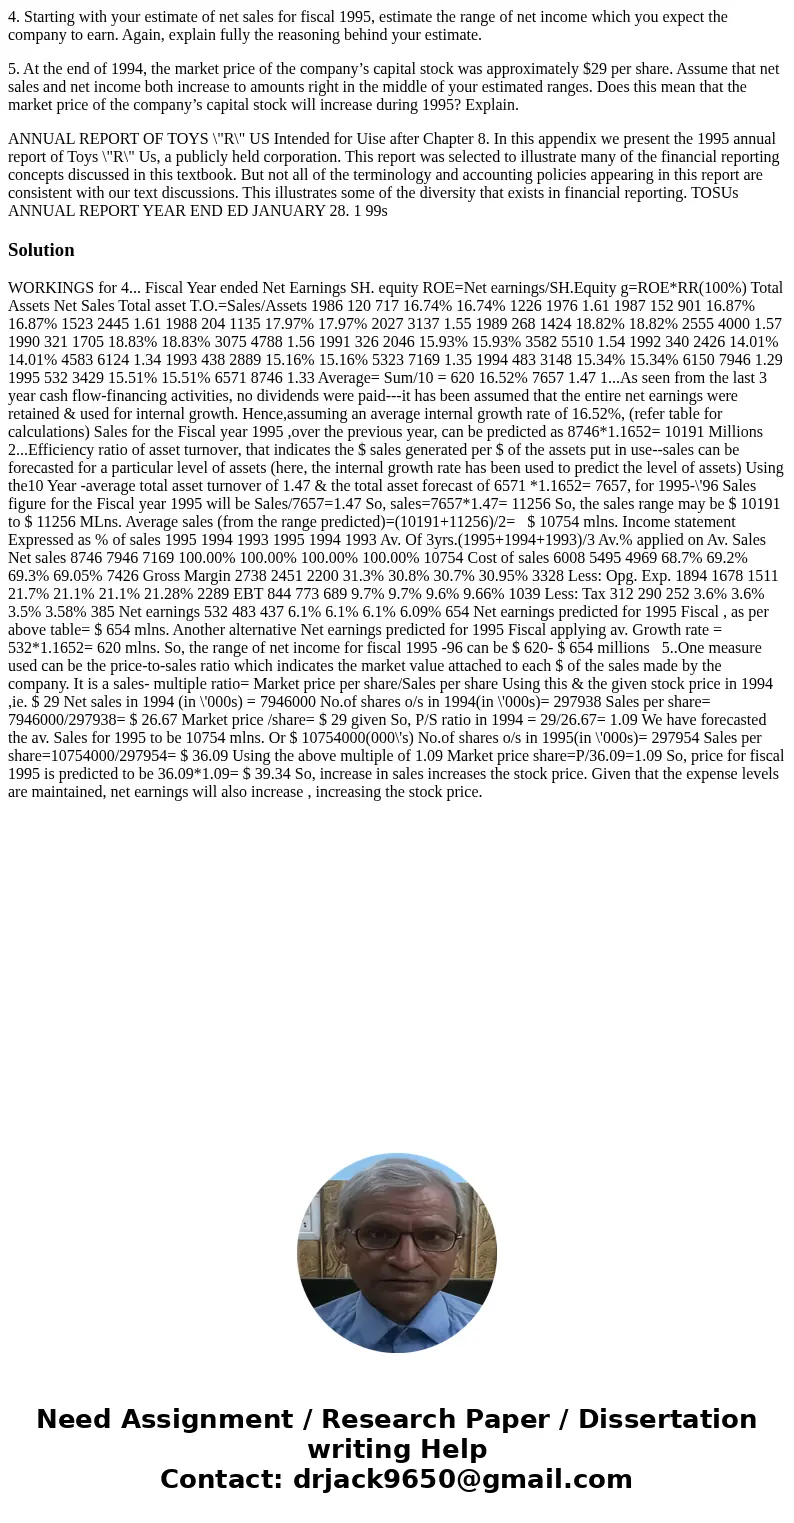
4. Starting with your estimate of net sales for fiscal 1995, estimate the range of net income which you expect the company to earn. Again, explain fully the reasoning behind your estimate.
5. At the end of 1994, the market price of the company’s capital stock was approximately $29 per share. Assume that net sales and net income both increase to amounts right in the middle of your estimated ranges. Does this mean that the market price of the company’s capital stock will increase during 1995? Explain.
ANNUAL REPORT OF TOYS \"R\" US Intended for Uise after Chapter 8. In this appendix we present the 1995 annual report of Toys \"R\" Us, a publicly held corporation. This report was selected to illustrate many of the financial reporting concepts discussed in this textbook. But not all of the terminology and accounting policies appearing in this report are consistent with our text discussions. This illustrates some of the diversity that exists in financial reporting. TOSUs ANNUAL REPORT YEAR END ED JANUARY 28. 1 99sSolution
WORKINGS for 4... Fiscal Year ended Net Earnings SH. equity ROE=Net earnings/SH.Equity g=ROE*RR(100%) Total Assets Net Sales Total asset T.O.=Sales/Assets 1986 120 717 16.74% 16.74% 1226 1976 1.61 1987 152 901 16.87% 16.87% 1523 2445 1.61 1988 204 1135 17.97% 17.97% 2027 3137 1.55 1989 268 1424 18.82% 18.82% 2555 4000 1.57 1990 321 1705 18.83% 18.83% 3075 4788 1.56 1991 326 2046 15.93% 15.93% 3582 5510 1.54 1992 340 2426 14.01% 14.01% 4583 6124 1.34 1993 438 2889 15.16% 15.16% 5323 7169 1.35 1994 483 3148 15.34% 15.34% 6150 7946 1.29 1995 532 3429 15.51% 15.51% 6571 8746 1.33 Average= Sum/10 = 620 16.52% 7657 1.47 1...As seen from the last 3 year cash flow-financing activities, no dividends were paid---it has been assumed that the entire net earnings were retained & used for internal growth. Hence,assuming an average internal growth rate of 16.52%, (refer table for calculations) Sales for the Fiscal year 1995 ,over the previous year, can be predicted as 8746*1.1652= 10191 Millions 2...Efficiency ratio of asset turnover, that indicates the $ sales generated per $ of the assets put in use--sales can be forecasted for a particular level of assets (here, the internal growth rate has been used to predict the level of assets) Using the10 Year -average total asset turnover of 1.47 & the total asset forecast of 6571 *1.1652= 7657, for 1995-\'96 Sales figure for the Fiscal year 1995 will be Sales/7657=1.47 So, sales=7657*1.47= 11256 So, the sales range may be $ 10191 to $ 11256 MLns. Average sales (from the range predicted)=(10191+11256)/2= $ 10754 mlns. Income statement Expressed as % of sales 1995 1994 1993 1995 1994 1993 Av. Of 3yrs.(1995+1994+1993)/3 Av.% applied on Av. Sales Net sales 8746 7946 7169 100.00% 100.00% 100.00% 100.00% 10754 Cost of sales 6008 5495 4969 68.7% 69.2% 69.3% 69.05% 7426 Gross Margin 2738 2451 2200 31.3% 30.8% 30.7% 30.95% 3328 Less: Opg. Exp. 1894 1678 1511 21.7% 21.1% 21.1% 21.28% 2289 EBT 844 773 689 9.7% 9.7% 9.6% 9.66% 1039 Less: Tax 312 290 252 3.6% 3.6% 3.5% 3.58% 385 Net earnings 532 483 437 6.1% 6.1% 6.1% 6.09% 654 Net earnings predicted for 1995 Fiscal , as per above table= $ 654 mlns. Another alternative Net earnings predicted for 1995 Fiscal applying av. Growth rate = 532*1.1652= 620 mlns. So, the range of net income for fiscal 1995 -96 can be $ 620- $ 654 millions 5..One measure used can be the price-to-sales ratio which indicates the market value attached to each $ of the sales made by the company. It is a sales- multiple ratio= Market price per share/Sales per share Using this & the given stock price in 1994 ,ie. $ 29 Net sales in 1994 (in \'000s) = 7946000 No.of shares o/s in 1994(in \'000s)= 297938 Sales per share= 7946000/297938= $ 26.67 Market price /share= $ 29 given So, P/S ratio in 1994 = 29/26.67= 1.09 We have forecasted the av. Sales for 1995 to be 10754 mlns. Or $ 10754000(000\'s) No.of shares o/s in 1995(in \'000s)= 297954 Sales per share=10754000/297954= $ 36.09 Using the above multiple of 1.09 Market price share=P/36.09=1.09 So, price for fiscal 1995 is predicted to be 36.09*1.09= $ 39.34 So, increase in sales increases the stock price. Given that the expense levels are maintained, net earnings will also increase , increasing the stock price.
 Homework Sourse