Frequency f Compare the mean of the raw data with the mean f
Frequency, f
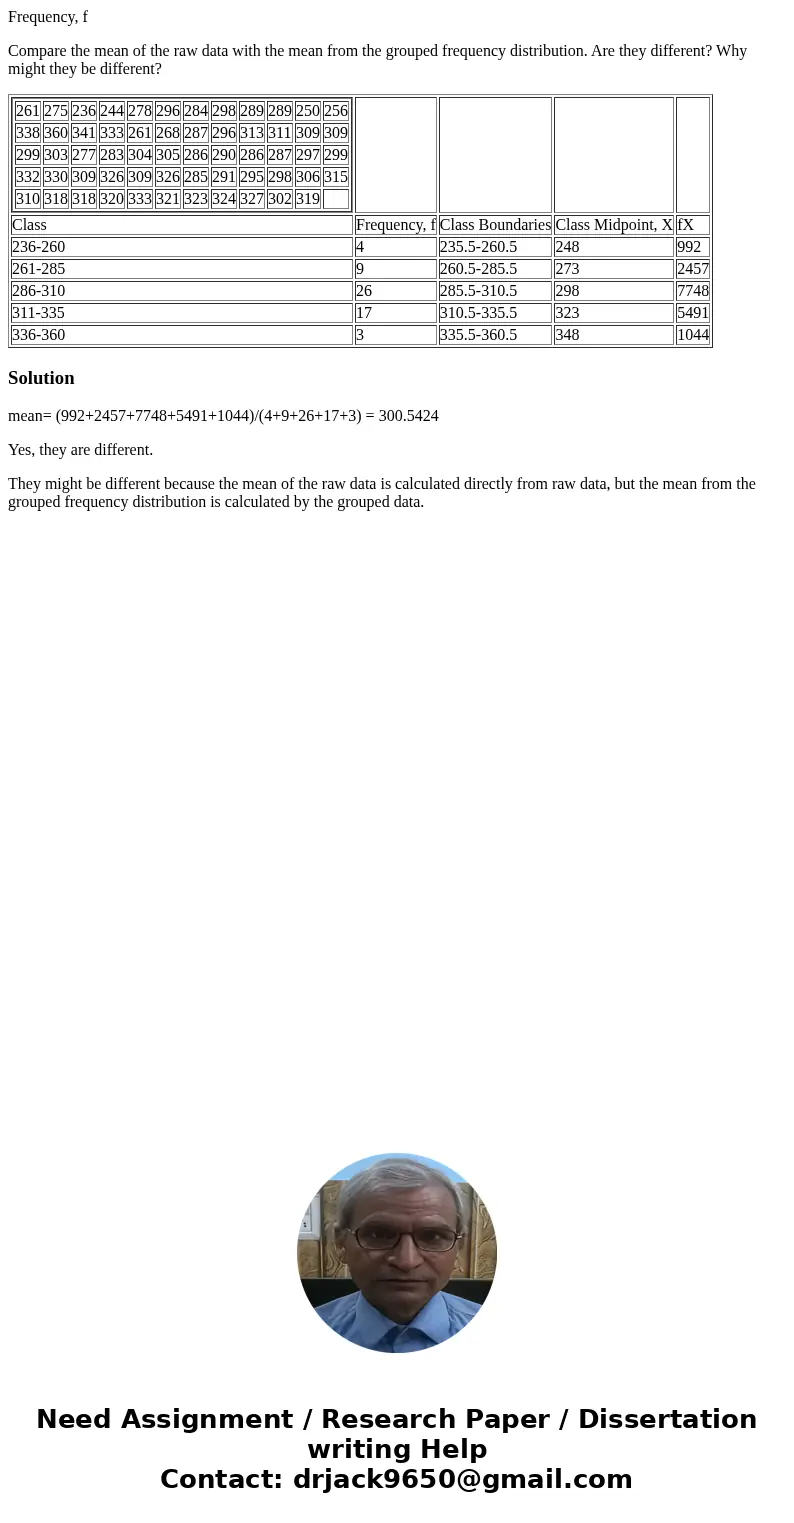
Compare the mean of the raw data with the mean from the grouped frequency distribution. Are they different? Why might they be different?
| ||||||||||||||||||||||||||||||||||||||||||||||||||||||||||||||||
| Class | Frequency, f | Class Boundaries | Class Midpoint, X | fX | ||||||||||||||||||||||||||||||||||||||||||||||||||||||||||||
| 236-260 | 4 | 235.5-260.5 | 248 | 992 | ||||||||||||||||||||||||||||||||||||||||||||||||||||||||||||
| 261-285 | 9 | 260.5-285.5 | 273 | 2457 | ||||||||||||||||||||||||||||||||||||||||||||||||||||||||||||
| 286-310 | 26 | 285.5-310.5 | 298 | 7748 | ||||||||||||||||||||||||||||||||||||||||||||||||||||||||||||
| 311-335 | 17 | 310.5-335.5 | 323 | 5491 | ||||||||||||||||||||||||||||||||||||||||||||||||||||||||||||
| 336-360 | 3 | 335.5-360.5 | 348 | 1044 |
Solution
mean= (992+2457+7748+5491+1044)/(4+9+26+17+3) = 300.5424
Yes, they are different.
They might be different because the mean of the raw data is calculated directly from raw data, but the mean from the grouped frequency distribution is calculated by the grouped data.

 Homework Sourse