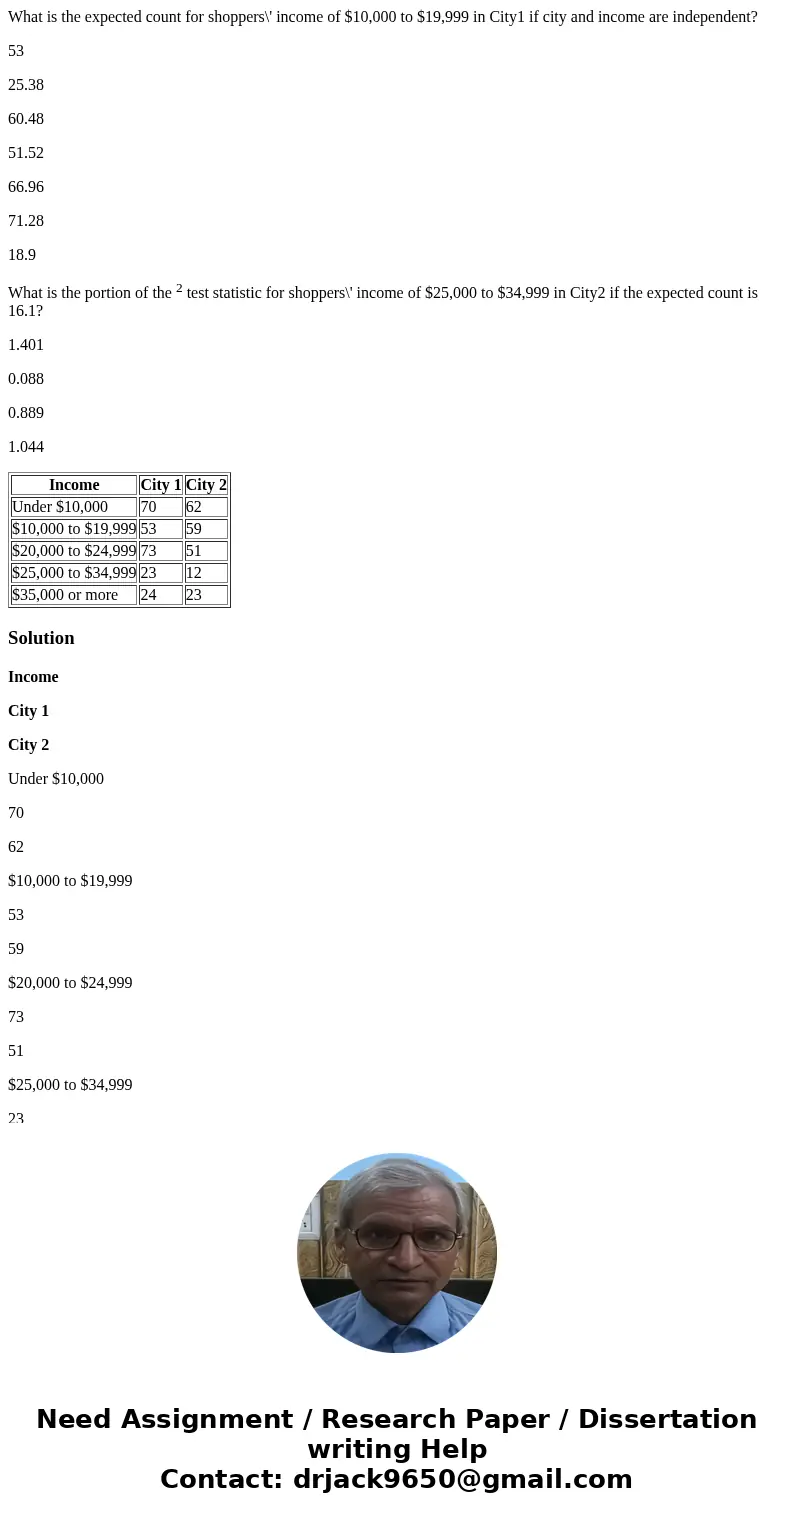
What is the expected count for shoppers income of 10000 to 1
What is the expected count for shoppers\' income of $10,000 to $19,999 in City1 if city and income are independent?
53
25.38
60.48
51.52
66.96
71.28
18.9
What is the portion of the 2 test statistic for shoppers\' income of $25,000 to $34,999 in City2 if the expected count is 16.1?
1.401
0.088
0.889
1.044
| Income | City 1 | City 2 |
|---|---|---|
| Under $10,000 | 70 | 62 |
| $10,000 to $19,999 | 53 | 59 |
| $20,000 to $24,999 | 73 | 51 |
| $25,000 to $34,999 | 23 | 12 |
| $35,000 or more | 24 | 23 |
Solution
Income
City 1
City 2
Under $10,000
70
62
$10,000 to $19,999
53
59
$20,000 to $24,999
73
51
$25,000 to $34,999
23
12
$35,000 or more
24
23
What is the expected count for shoppers\' income of $10,000 to $19,999 in City1 if city and income are independent?
53
25.38
60.48
51.52
66.96
71.28
18.9
Answer 60.48
What is the portion of the 2 test statistic for shoppers\' income of $25,000 to $34,999 in City2 if the expected count is 16.1?
1.401
0.088
0.889
1.044
Answer: 1.044
Observed Frequencies
City 1
City 2
Total
Under $10,000
70
62
132
$10,000 to $19,999
53
59
112
$20,000 to $24,999
73
51
124
$25,000 to $34,999
23
12
35
$35,000 or more
24
23
47
Total
243
207
450
Expected Frequencies
0
City 1
City 2
Total
Under $10,000
71.28
60.72
132
$10,000 to $19,999
60.48
51.52
112
$20,000 to $24,999
66.96
57.04
124
$25,000 to $34,999
18.9
16.1
35
$35,000 or more
25.38
21.62
47
Total
243
207
450
Calculations
fo-fe
-1.28
1.28
-7.48
7.48
6.04
-6.04
4.1
-4.1
-1.38
1.38
(fo-fe)^2/fe
0.0230
0.0270
0.9251
1.0860
0.5448
0.6396
0.8894
1.0441
0.0750
0.0881
Results
Critical Value
9.488
Chi-Square Test Statistic
5.3421
p-Value
0.254
Do not reject the null hypothesis
| Income | City 1 | City 2 |
| Under $10,000 | 70 | 62 |
| $10,000 to $19,999 | 53 | 59 |
| $20,000 to $24,999 | 73 | 51 |
| $25,000 to $34,999 | 23 | 12 |
| $35,000 or more | 24 | 23 |
 Homework Sourse