The manager of a furniture company has collected data on the
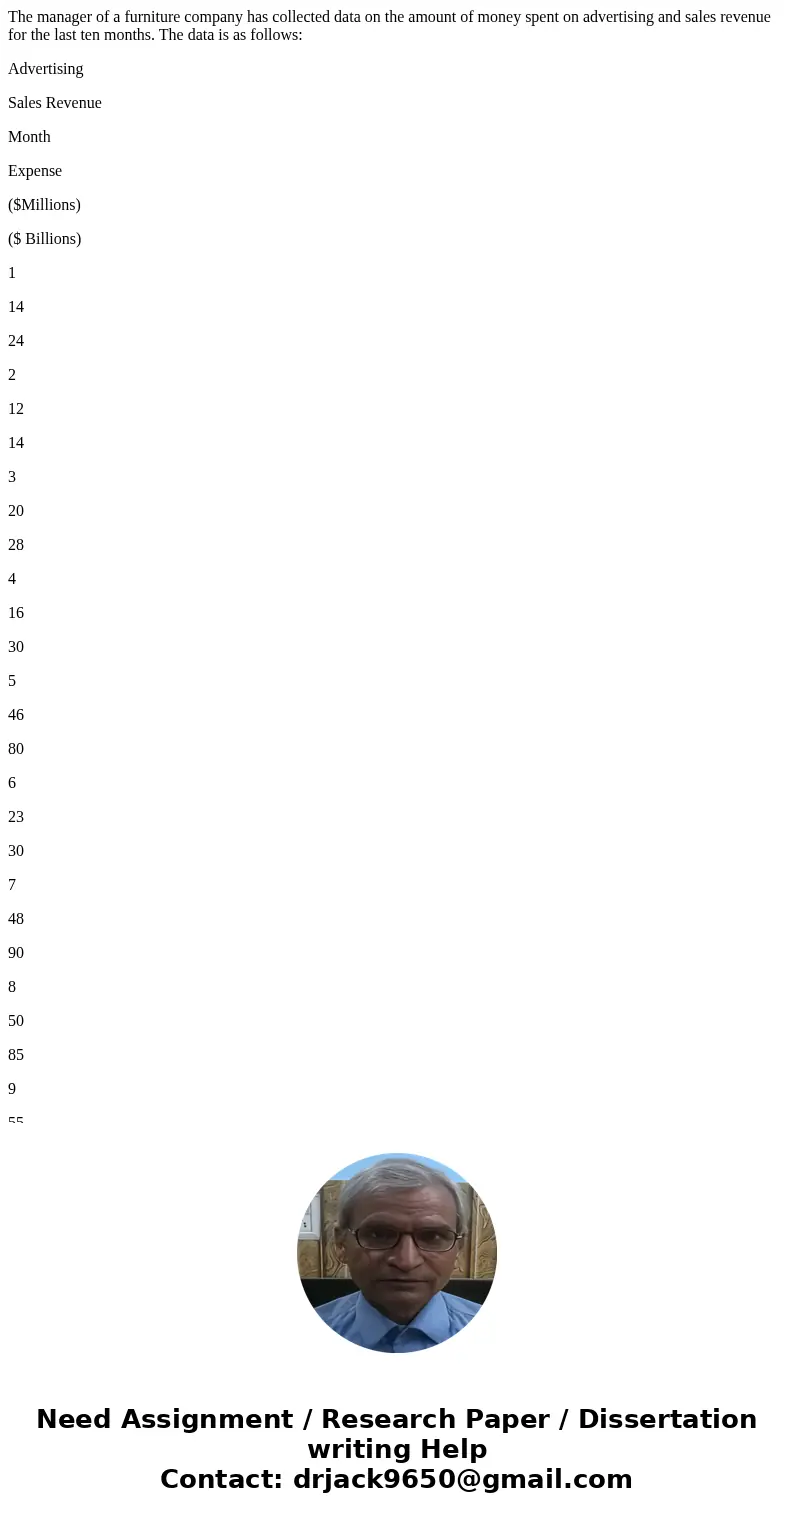
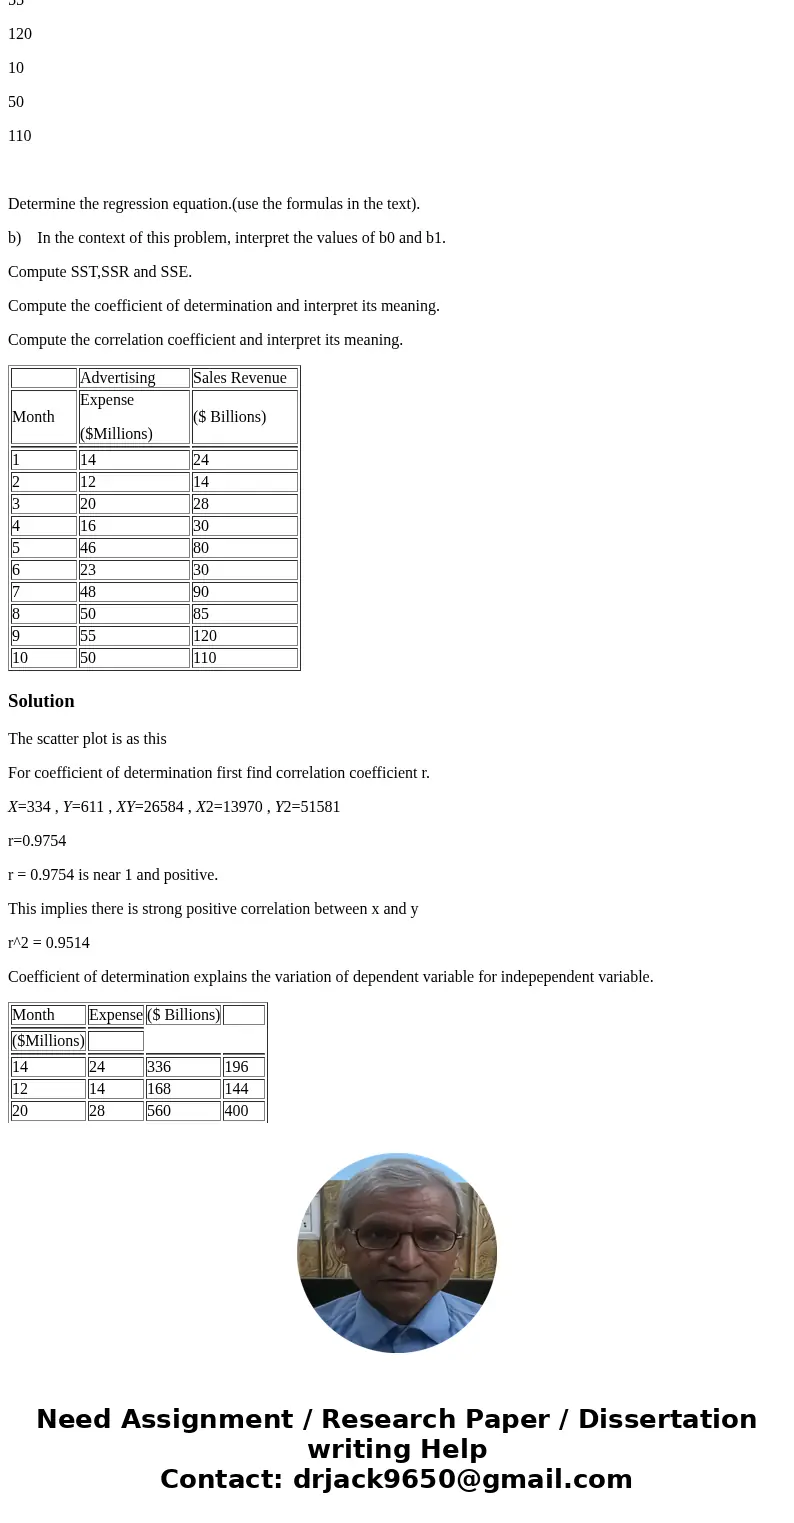
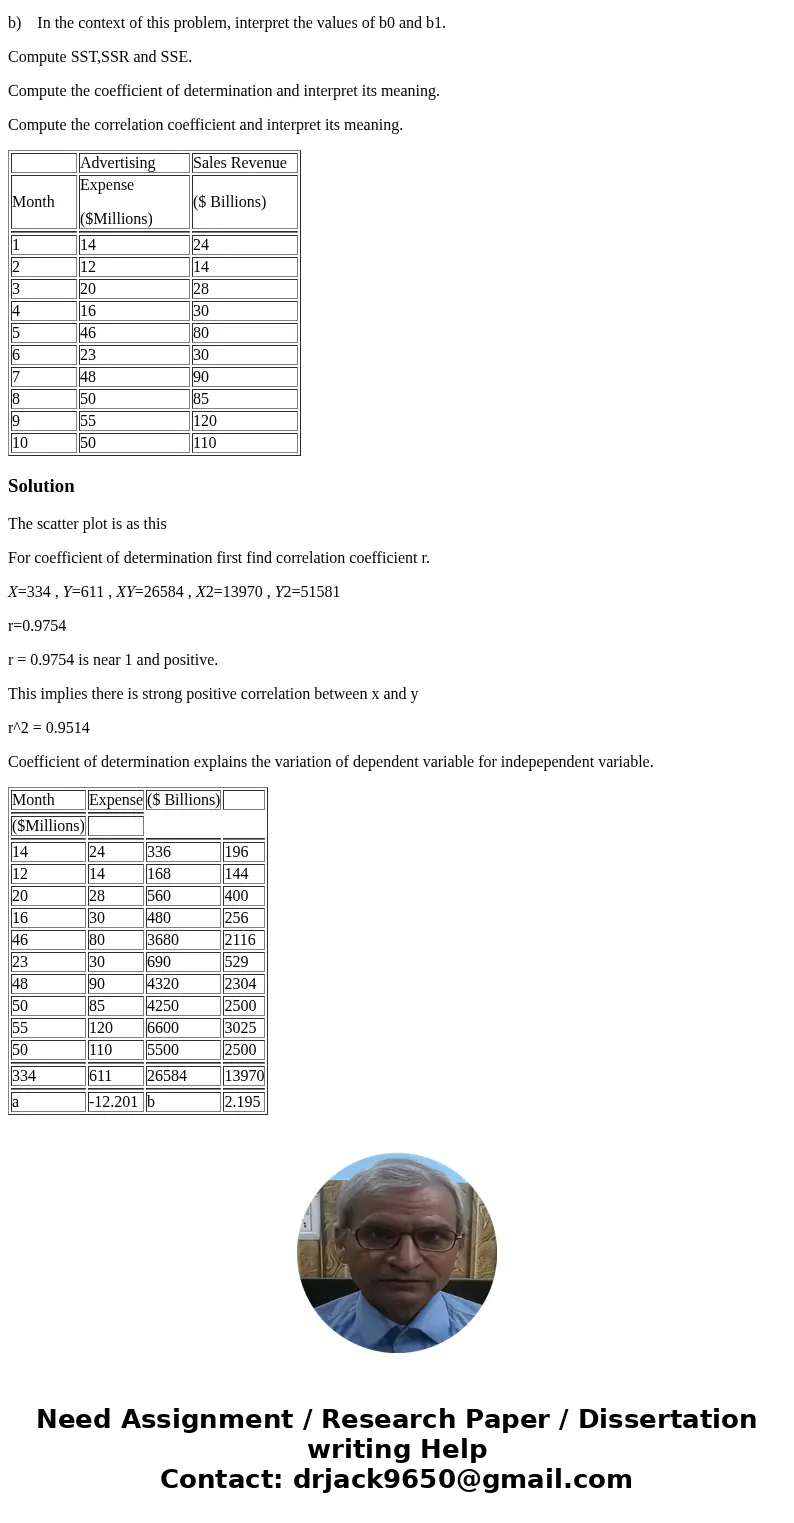
The manager of a furniture company has collected data on the amount of money spent on advertising and sales revenue for the last ten months. The data is as follows:
Advertising
Sales Revenue
Month
Expense
($Millions)
($ Billions)
1
14
24
2
12
14
3
20
28
4
16
30
5
46
80
6
23
30
7
48
90
8
50
85
9
55
120
10
50
110
Determine the regression equation.(use the formulas in the text).
b) In the context of this problem, interpret the values of b0 and b1.
Compute SST,SSR and SSE.
Compute the coefficient of determination and interpret its meaning.
Compute the correlation coefficient and interpret its meaning.
| Advertising | Sales Revenue | |
| Month | Expense ($Millions) | ($ Billions) |
| 1 | 14 | 24 |
| 2 | 12 | 14 |
| 3 | 20 | 28 |
| 4 | 16 | 30 |
| 5 | 46 | 80 |
| 6 | 23 | 30 |
| 7 | 48 | 90 |
| 8 | 50 | 85 |
| 9 | 55 | 120 |
| 10 | 50 | 110 |
Solution
The scatter plot is as this
For coefficient of determination first find correlation coefficient r.
X=334 , Y=611 , XY=26584 , X2=13970 , Y2=51581
r=0.9754
r = 0.9754 is near 1 and positive.
This implies there is strong positive correlation between x and y
r^2 = 0.9514
Coefficient of determination explains the variation of dependent variable for indepependent variable.
| Month | Expense | ($ Billions) | |
| ($Millions) | |||
| 14 | 24 | 336 | 196 |
| 12 | 14 | 168 | 144 |
| 20 | 28 | 560 | 400 |
| 16 | 30 | 480 | 256 |
| 46 | 80 | 3680 | 2116 |
| 23 | 30 | 690 | 529 |
| 48 | 90 | 4320 | 2304 |
| 50 | 85 | 4250 | 2500 |
| 55 | 120 | 6600 | 3025 |
| 50 | 110 | 5500 | 2500 |
| 334 | 611 | 26584 | 13970 |
| a | -12.201 | b | 2.195 |


 Homework Sourse