The data below shows the time in seconds that took 9 randoml
The data below shows the time (in seconds) that took 9 randomly selected individuals to complete a 16-piece, child’s puzzle both while sober and while legally intoxicated. Does this data indicated a statistically significant slowing of puzzle-solving abilities while intoxicated at the = 0.10 level of significance? [Assume the data come from a normally distributed population with no outliers.]
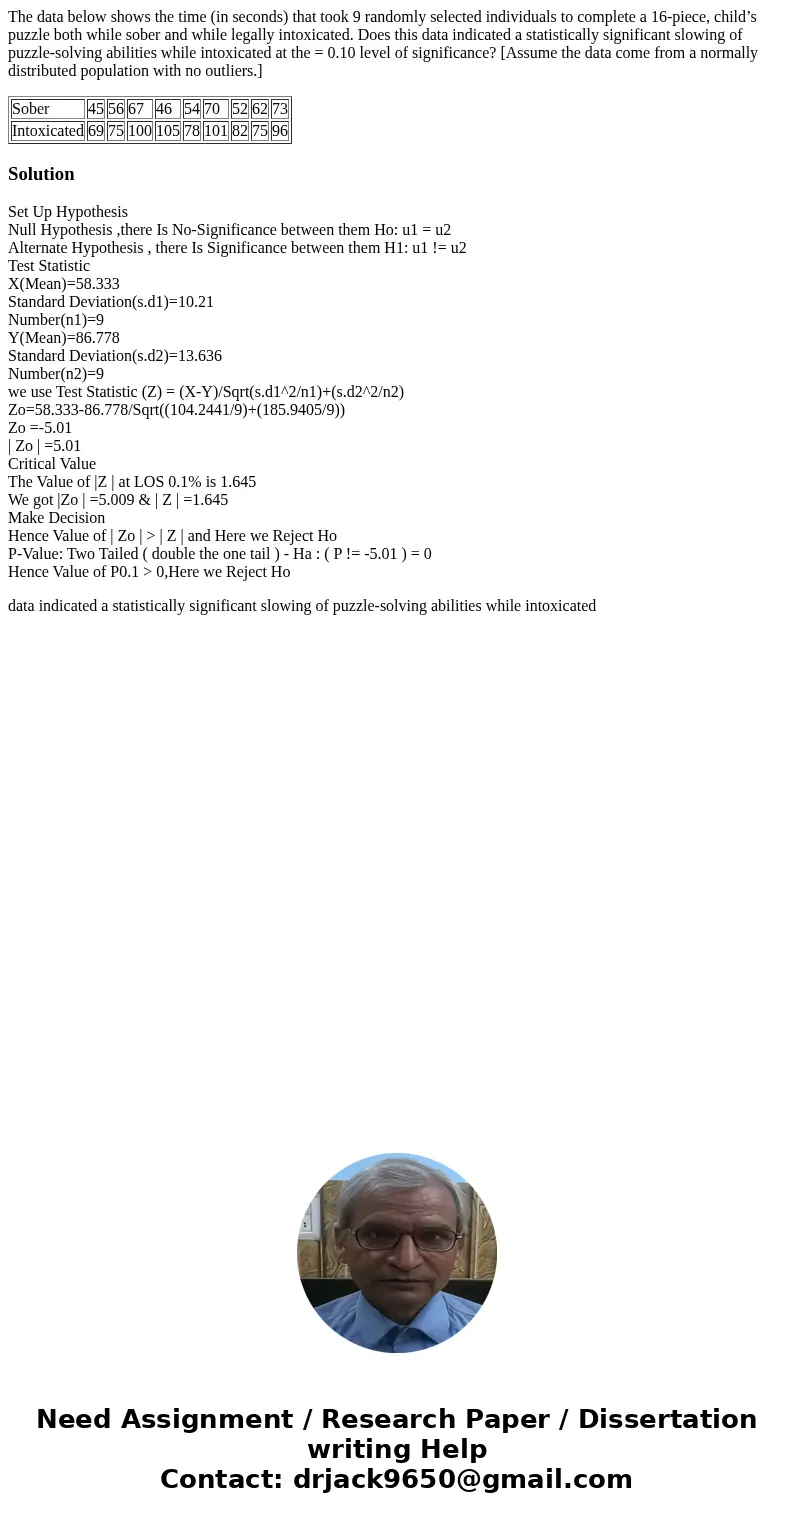
| Sober | 45 | 56 | 67 | 46 | 54 | 70 | 52 | 62 | 73 |
| Intoxicated | 69 | 75 | 100 | 105 | 78 | 101 | 82 | 75 | 96 |
Solution
Set Up Hypothesis
Null Hypothesis ,there Is No-Significance between them Ho: u1 = u2
Alternate Hypothesis , there Is Significance between them H1: u1 != u2
Test Statistic
X(Mean)=58.333
Standard Deviation(s.d1)=10.21
Number(n1)=9
Y(Mean)=86.778
Standard Deviation(s.d2)=13.636
Number(n2)=9
we use Test Statistic (Z) = (X-Y)/Sqrt(s.d1^2/n1)+(s.d2^2/n2)
Zo=58.333-86.778/Sqrt((104.2441/9)+(185.9405/9))
Zo =-5.01
| Zo | =5.01
Critical Value
The Value of |Z | at LOS 0.1% is 1.645
We got |Zo | =5.009 & | Z | =1.645
Make Decision
Hence Value of | Zo | > | Z | and Here we Reject Ho
P-Value: Two Tailed ( double the one tail ) - Ha : ( P != -5.01 ) = 0
Hence Value of P0.1 > 0,Here we Reject Ho
data indicated a statistically significant slowing of puzzle-solving abilities while intoxicated

 Homework Sourse