The following table gives the experimentally measured volume
The following table gives the experimentally measured volume per gram of mercury as a function of temperature.
10
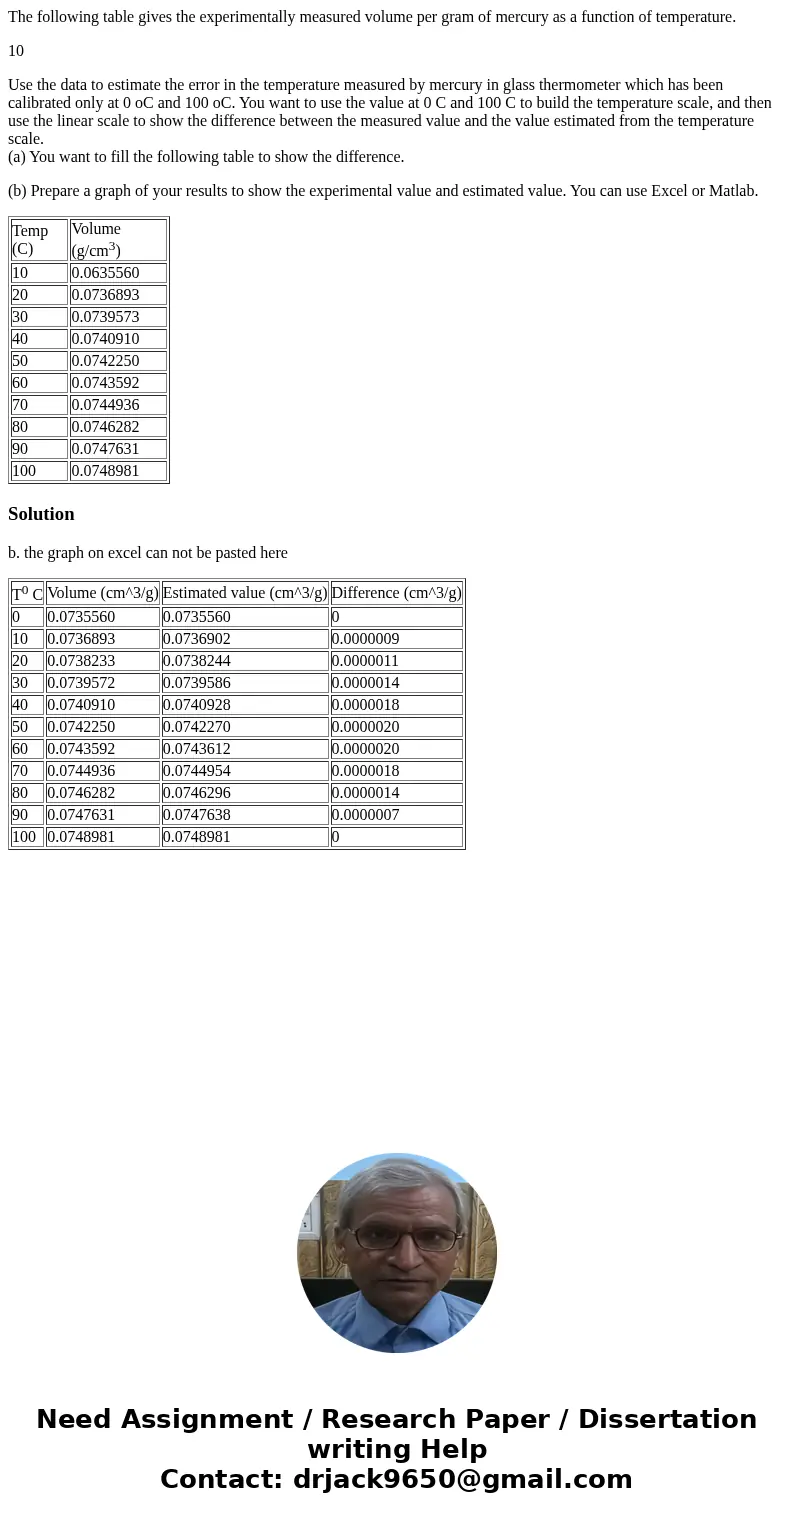
Use the data to estimate the error in the temperature measured by mercury in glass thermometer which has been calibrated only at 0 oC and 100 oC. You want to use the value at 0 C and 100 C to build the temperature scale, and then use the linear scale to show the difference between the measured value and the value estimated from the temperature scale.
(a) You want to fill the following table to show the difference.
(b) Prepare a graph of your results to show the experimental value and estimated value. You can use Excel or Matlab.
| Temp (C) | Volume (g/cm3) |
| 10 | 0.0635560 |
| 20 | 0.0736893 |
| 30 | 0.0739573 |
| 40 | 0.0740910 |
| 50 | 0.0742250 |
| 60 | 0.0743592 |
| 70 | 0.0744936 |
| 80 | 0.0746282 |
| 90 | 0.0747631 |
| 100 | 0.0748981 |
Solution
b. the graph on excel can not be pasted here
| T0 C | Volume (cm^3/g) | Estimated value (cm^3/g) | Difference (cm^3/g) |
| 0 | 0.0735560 | 0.0735560 | 0 |
| 10 | 0.0736893 | 0.0736902 | 0.0000009 |
| 20 | 0.0738233 | 0.0738244 | 0.0000011 |
| 30 | 0.0739572 | 0.0739586 | 0.0000014 |
| 40 | 0.0740910 | 0.0740928 | 0.0000018 |
| 50 | 0.0742250 | 0.0742270 | 0.0000020 |
| 60 | 0.0743592 | 0.0743612 | 0.0000020 |
| 70 | 0.0744936 | 0.0744954 | 0.0000018 |
| 80 | 0.0746282 | 0.0746296 | 0.0000014 |
| 90 | 0.0747631 | 0.0747638 | 0.0000007 |
| 100 | 0.0748981 | 0.0748981 | 0 |

 Homework Sourse