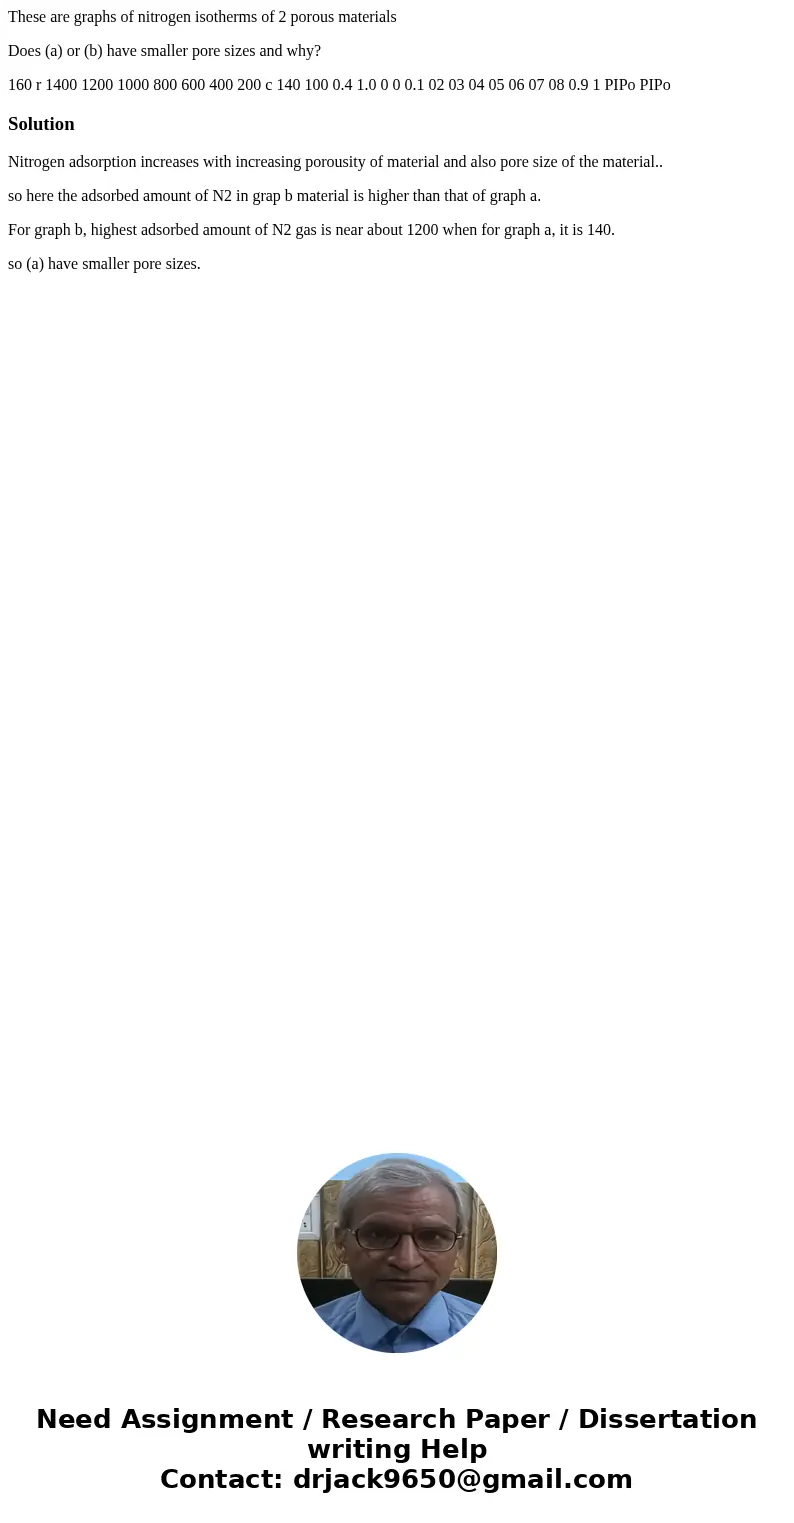
These are graphs of nitrogen isotherms of 2 porous materials
These are graphs of nitrogen isotherms of 2 porous materials
Does (a) or (b) have smaller pore sizes and why?
160 r 1400 1200 1000 800 600 400 200 c 140 100 0.4 1.0 0 0 0.1 02 03 04 05 06 07 08 0.9 1 PIPo PIPoSolution
Nitrogen adsorption increases with increasing porousity of material and also pore size of the material..
so here the adsorbed amount of N2 in grap b material is higher than that of graph a.
For graph b, highest adsorbed amount of N2 gas is near about 1200 when for graph a, it is 140.
so (a) have smaller pore sizes.

 Homework Sourse