please explain what these ratios mean for Target 3 ACTIVITY
please explain what these ratios mean for Target
| 3. ACTIVITY RATIOS | ||||||
| - | 2013 | 2014 | 2015 | 2016 | 2017 | Industry Average |
| Inventory Turnover | 9.3 | 8.2 | 8.3 | 8.6 | 8.4 | 8.53 |
| Days of Inventory | 56 | 63 | 63 | 60 | 62 | 60.78 |
| Net Working Capital Turnover | 31.10 | -59.58 | 30.89 | 48.93 | -96.79 | -9.09 |
| Asset Turnover | 1.5 | 1.6 | 1.8 | 1.8 | 1.9 | 1.72 |
| Fixed Asset Turnover | 239.13% | 217.49% | 265.83% | 282.35% | 273.16%. | 255.59% |
| Average Collection Period | 0.0 | 6.9 | 5.6 | 3.9 | 3.9 | 4.06 |
| Accounts Receivable Turnover | 5273.50% | 6275.22% | 8952.37% | 8942.99% | 7361.02% | |
| Accounts Payable Period | 43.60 | 54.40 | 54.82 | 51.71 | 53.81 | 51.67 |
Solution
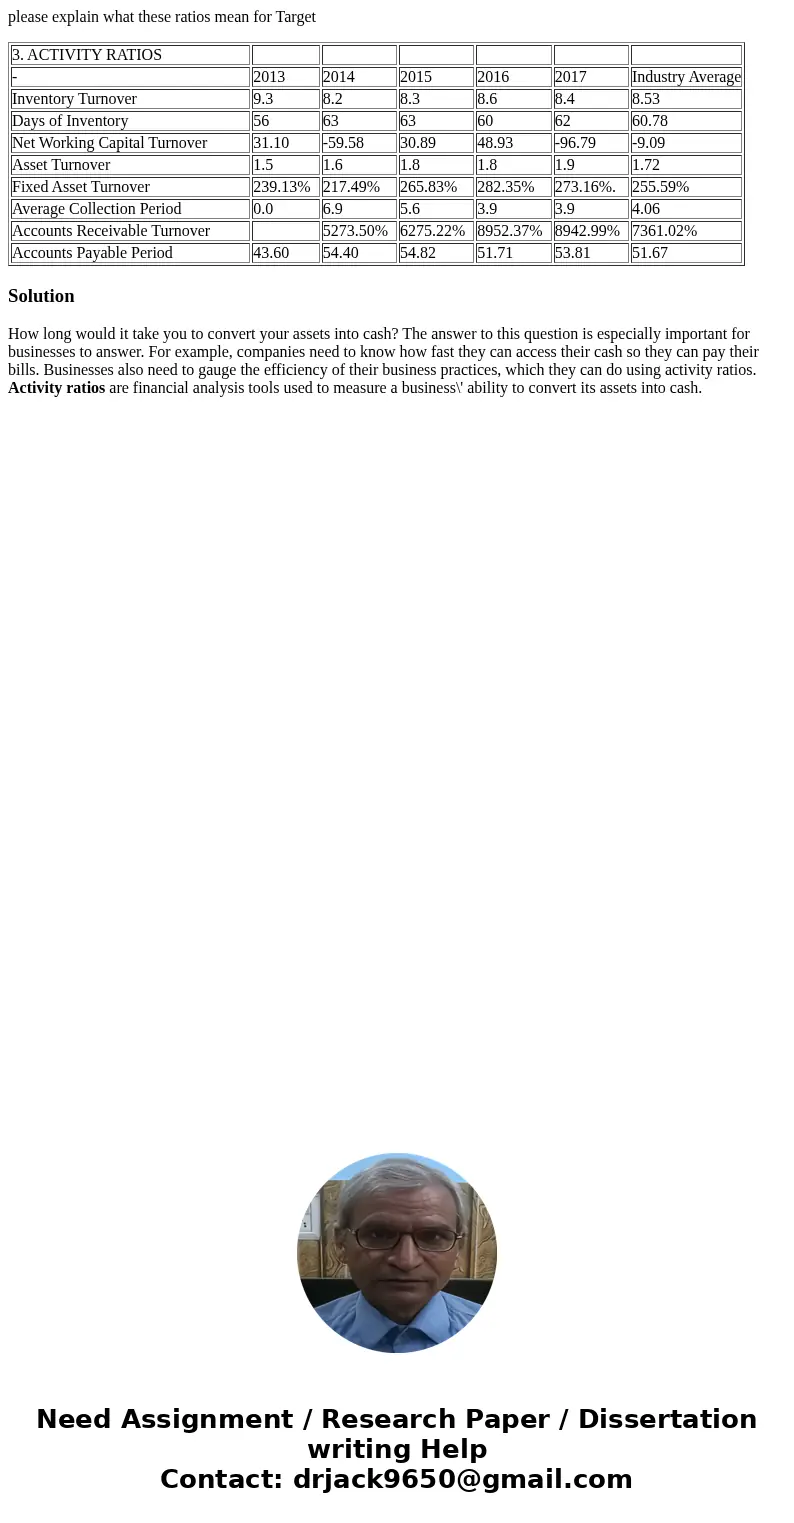
How long would it take you to convert your assets into cash? The answer to this question is especially important for businesses to answer. For example, companies need to know how fast they can access their cash so they can pay their bills. Businesses also need to gauge the efficiency of their business practices, which they can do using activity ratios. Activity ratios are financial analysis tools used to measure a business\' ability to convert its assets into cash.

 Homework Sourse