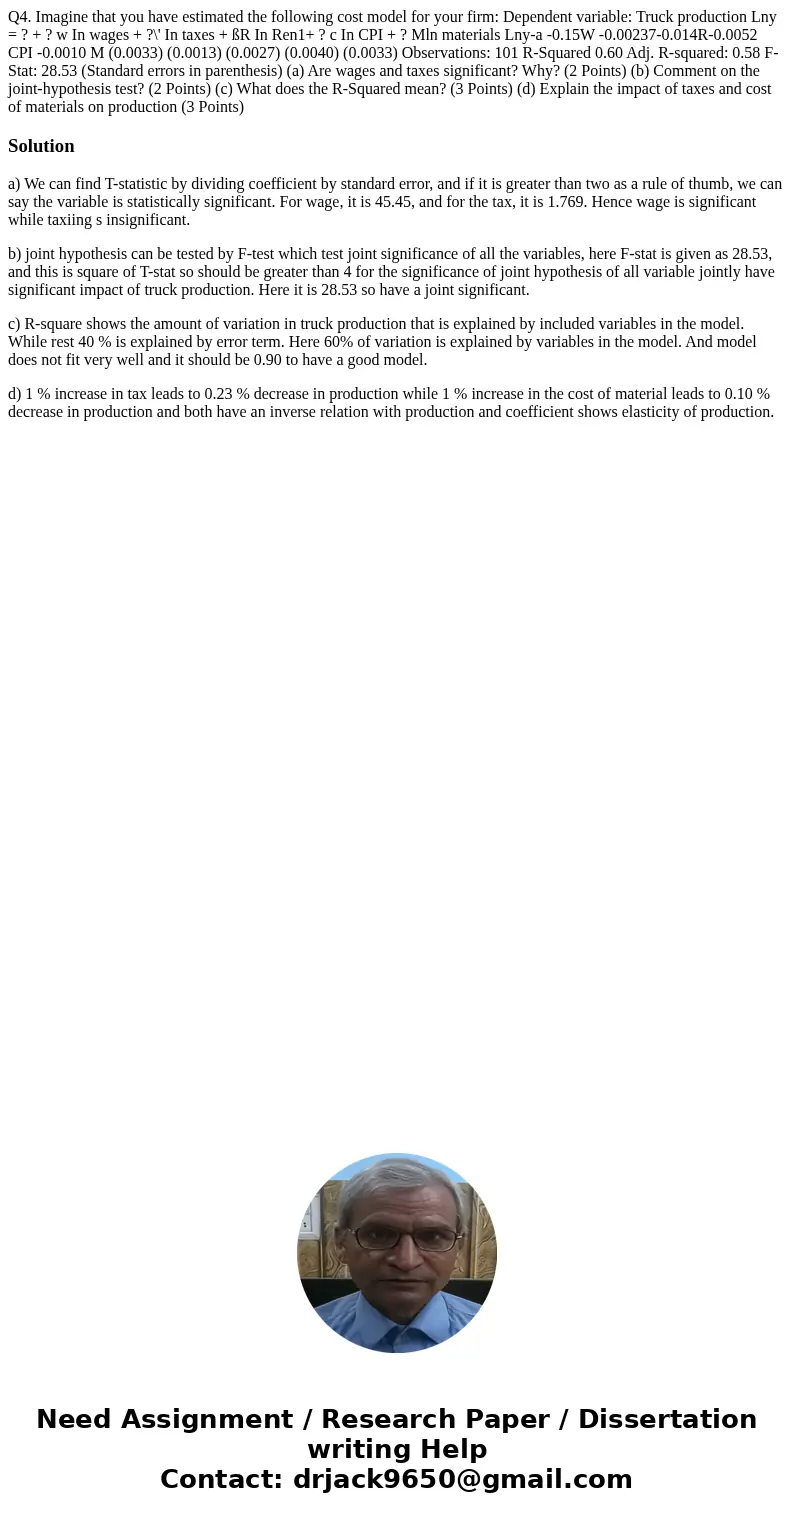
Q4 Imagine that you have estimated the following cost model
Solution
a) We can find T-statistic by dividing coefficient by standard error, and if it is greater than two as a rule of thumb, we can say the variable is statistically significant. For wage, it is 45.45, and for the tax, it is 1.769. Hence wage is significant while taxiing s insignificant.
b) joint hypothesis can be tested by F-test which test joint significance of all the variables, here F-stat is given as 28.53, and this is square of T-stat so should be greater than 4 for the significance of joint hypothesis of all variable jointly have significant impact of truck production. Here it is 28.53 so have a joint significant.
c) R-square shows the amount of variation in truck production that is explained by included variables in the model. While rest 40 % is explained by error term. Here 60% of variation is explained by variables in the model. And model does not fit very well and it should be 0.90 to have a good model.
d) 1 % increase in tax leads to 0.23 % decrease in production while 1 % increase in the cost of material leads to 0.10 % decrease in production and both have an inverse relation with production and coefficient shows elasticity of production.

 Homework Sourse