We have the following observations drawn from a normally dis
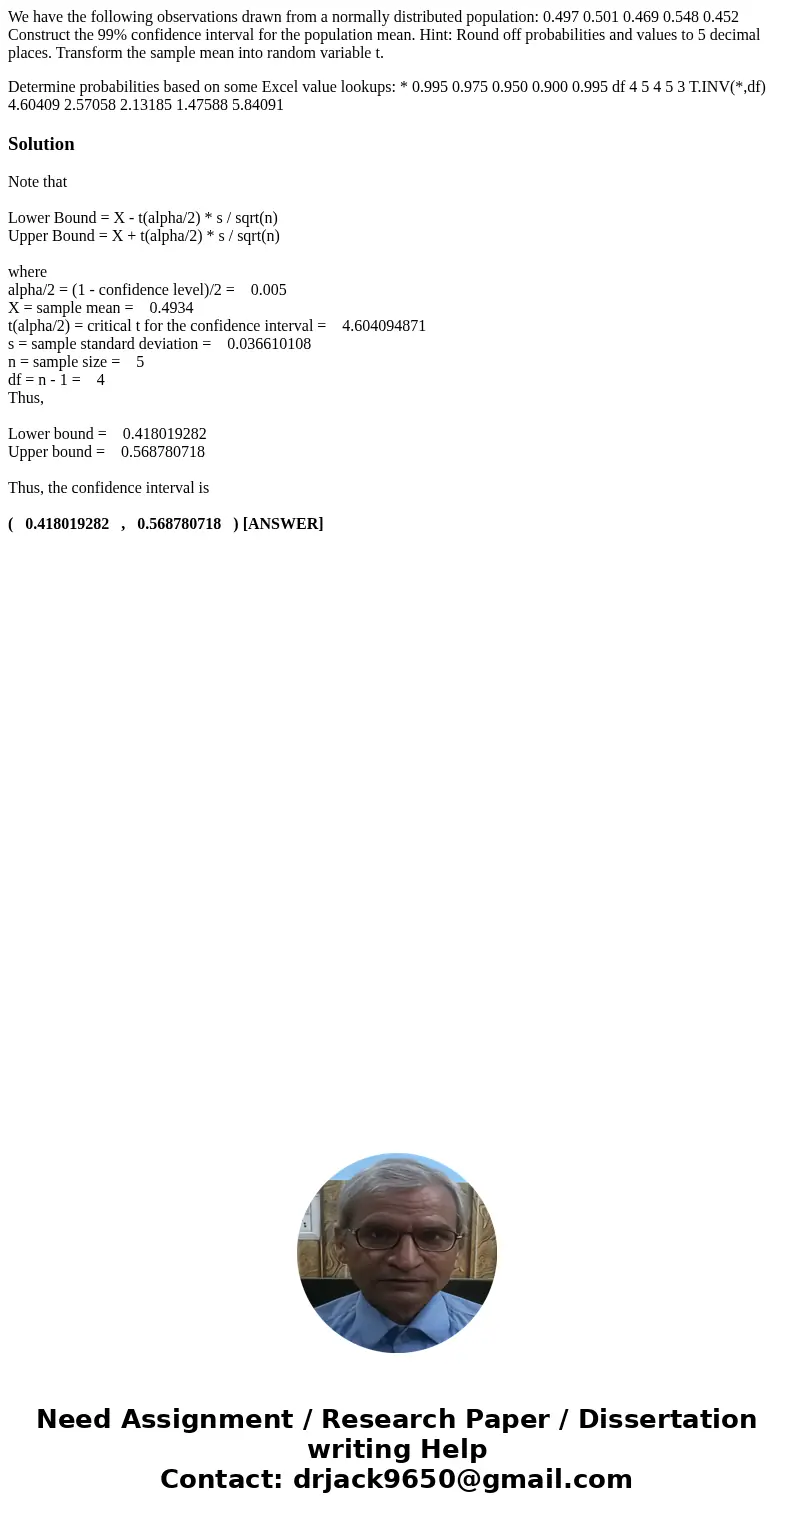
We have the following observations drawn from a normally distributed population: 0.497 0.501 0.469 0.548 0.452 Construct the 99% confidence interval for the population mean. Hint: Round off probabilities and values to 5 decimal places. Transform the sample mean into random variable t.
Determine probabilities based on some Excel value lookups: * 0.995 0.975 0.950 0.900 0.995 df 4 5 4 5 3 T.INV(*,df) 4.60409 2.57058 2.13185 1.47588 5.84091
Solution
Note that
Lower Bound = X - t(alpha/2) * s / sqrt(n)
Upper Bound = X + t(alpha/2) * s / sqrt(n)
where
alpha/2 = (1 - confidence level)/2 = 0.005
X = sample mean = 0.4934
t(alpha/2) = critical t for the confidence interval = 4.604094871
s = sample standard deviation = 0.036610108
n = sample size = 5
df = n - 1 = 4
Thus,
Lower bound = 0.418019282
Upper bound = 0.568780718
Thus, the confidence interval is
( 0.418019282 , 0.568780718 ) [ANSWER]

 Homework Sourse