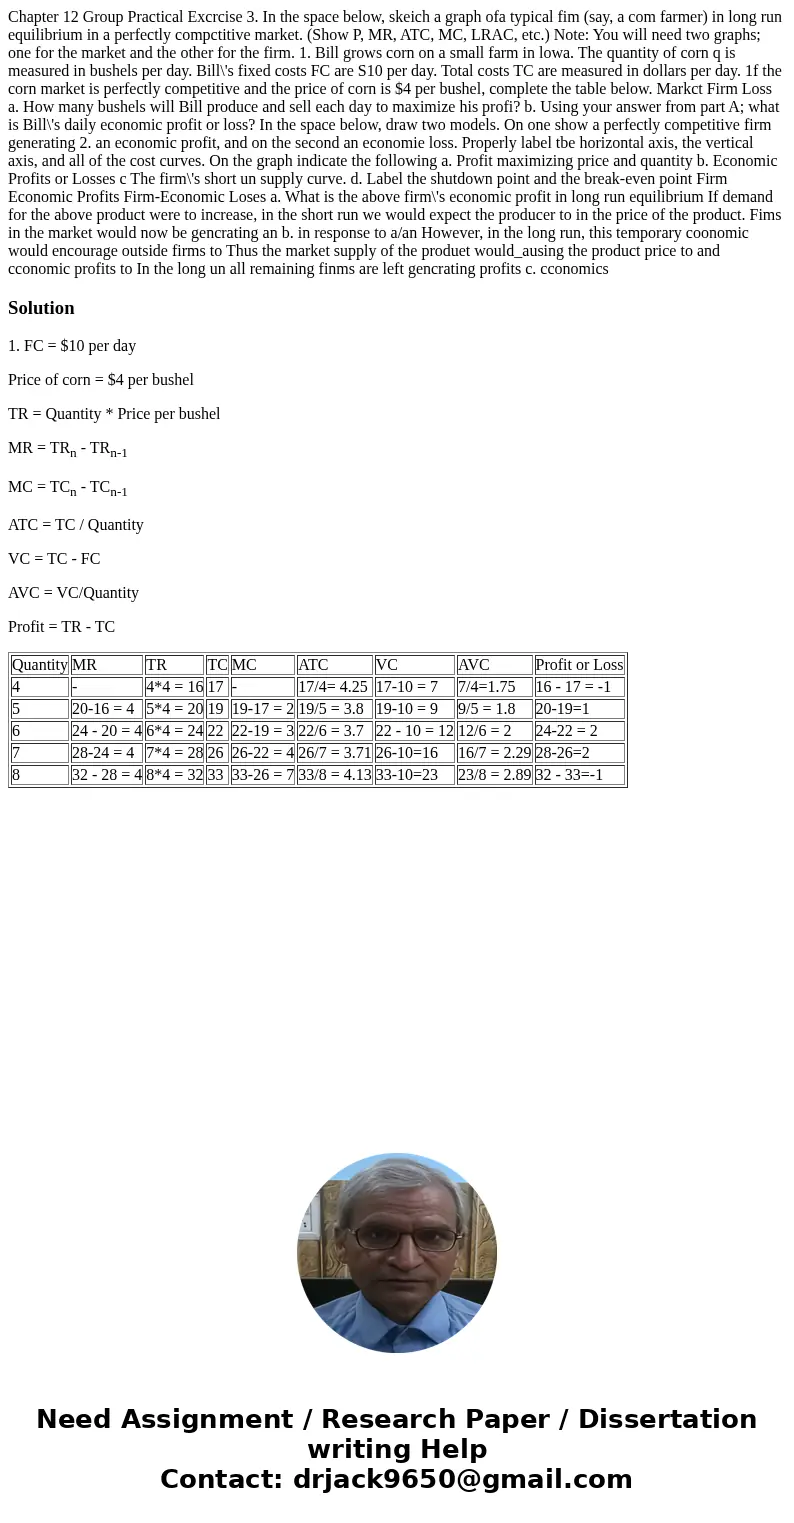
Chapter 12 Group Practical Excrcise 3 In the space below ske
Chapter 12 Group Practical Excrcise 3. In the space below, skeich a graph ofa typical fim (say, a com farmer) in long run equilibrium in a perfectly compctitive market. (Show P, MR, ATC, MC, LRAC, etc.) Note: You will need two graphs; one for the market and the other for the firm. 1. Bill grows corn on a small farm in lowa. The quantity of corn q is measured in bushels per day. Bill\'s fixed costs FC are S10 per day. Total costs TC are measured in dollars per day. 1f the corn market is perfectly competitive and the price of corn is $4 per bushel, complete the table below. Markct Firm Loss a. How many bushels will Bill produce and sell each day to maximize his profi? b. Using your answer from part A; what is Bill\'s daily economic profit or loss? In the space below, draw two models. On one show a perfectly competitive firm generating 2. an economic profit, and on the second an economie loss. Properly label tbe horizontal axis, the vertical axis, and all of the cost curves. On the graph indicate the following a. Profit maximizing price and quantity b. Economic Profits or Losses c The firm\'s short un supply curve. d. Label the shutdown point and the break-even point Firm Economic Profits Firm-Economic Loses a. What is the above firm\'s economic profit in long run equilibrium If demand for the above product were to increase, in the short run we would expect the producer to in the price of the product. Fims in the market would now be gencrating an b. in response to a/an However, in the long run, this temporary coonomic would encourage outside firms to Thus the market supply of the produet would_ausing the product price to and cconomic profits to In the long un all remaining finms are left gencrating profits c. cconomics

Solution
1. FC = $10 per day
Price of corn = $4 per bushel
TR = Quantity * Price per bushel
MR = TRn - TRn-1
MC = TCn - TCn-1
ATC = TC / Quantity
VC = TC - FC
AVC = VC/Quantity
Profit = TR - TC
| Quantity | MR | TR | TC | MC | ATC | VC | AVC | Profit or Loss |
| 4 | - | 4*4 = 16 | 17 | - | 17/4= 4.25 | 17-10 = 7 | 7/4=1.75 | 16 - 17 = -1 |
| 5 | 20-16 = 4 | 5*4 = 20 | 19 | 19-17 = 2 | 19/5 = 3.8 | 19-10 = 9 | 9/5 = 1.8 | 20-19=1 |
| 6 | 24 - 20 = 4 | 6*4 = 24 | 22 | 22-19 = 3 | 22/6 = 3.7 | 22 - 10 = 12 | 12/6 = 2 | 24-22 = 2 |
| 7 | 28-24 = 4 | 7*4 = 28 | 26 | 26-22 = 4 | 26/7 = 3.71 | 26-10=16 | 16/7 = 2.29 | 28-26=2 |
| 8 | 32 - 28 = 4 | 8*4 = 32 | 33 | 33-26 = 7 | 33/8 = 4.13 | 33-10=23 | 23/8 = 2.89 | 32 - 33=-1 |

 Homework Sourse