Rotorua Products Ltd of New Zealand markets agricultural pro
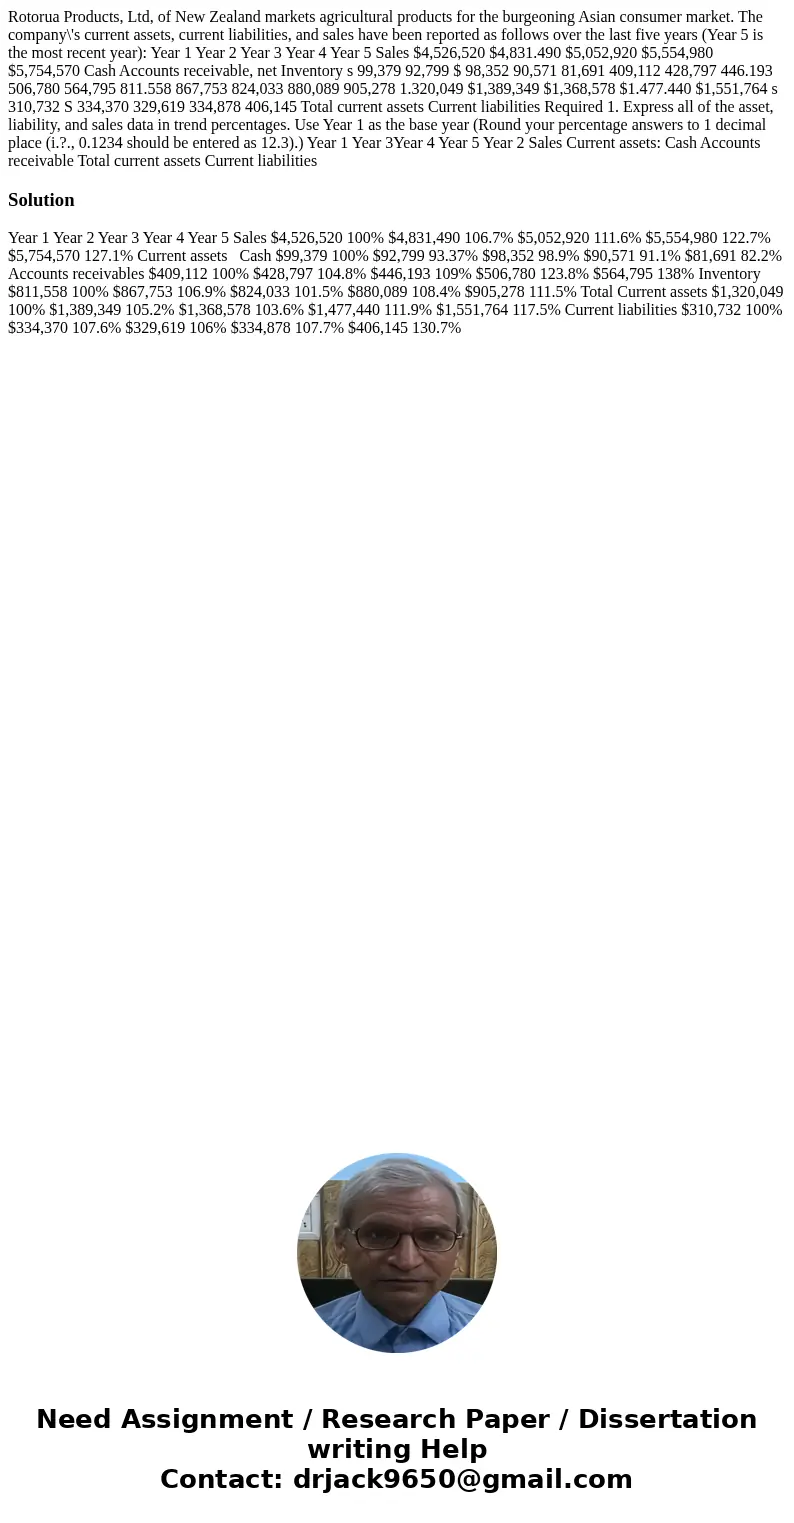
Rotorua Products, Ltd, of New Zealand markets agricultural products for the burgeoning Asian consumer market. The company\'s current assets, current liabilities, and sales have been reported as follows over the last five years (Year 5 is the most recent year): Year 1 Year 2 Year 3 Year 4 Year 5 Sales $4,526,520 $4,831.490 $5,052,920 $5,554,980 $5,754,570 Cash Accounts receivable, net Inventory s 99,379 92,799 $ 98,352 90,571 81,691 409,112 428,797 446.193 506,780 564,795 811.558 867,753 824,033 880,089 905,278 1.320,049 $1,389,349 $1,368,578 $1.477.440 $1,551,764 s 310,732 S 334,370 329,619 334,878 406,145 Total current assets Current liabilities Required 1. Express all of the asset, liability, and sales data in trend percentages. Use Year 1 as the base year (Round your percentage answers to 1 decimal place (i.?., 0.1234 should be entered as 12.3).) Year 1 Year 3Year 4 Year 5 Year 2 Sales Current assets: Cash Accounts receivable Total current assets Current liabilities 
Solution
Year 1 Year 2 Year 3 Year 4 Year 5 Sales $4,526,520 100% $4,831,490 106.7% $5,052,920 111.6% $5,554,980 122.7% $5,754,570 127.1% Current assets Cash $99,379 100% $92,799 93.37% $98,352 98.9% $90,571 91.1% $81,691 82.2% Accounts receivables $409,112 100% $428,797 104.8% $446,193 109% $506,780 123.8% $564,795 138% Inventory $811,558 100% $867,753 106.9% $824,033 101.5% $880,089 108.4% $905,278 111.5% Total Current assets $1,320,049 100% $1,389,349 105.2% $1,368,578 103.6% $1,477,440 111.9% $1,551,764 117.5% Current liabilities $310,732 100% $334,370 107.6% $329,619 106% $334,878 107.7% $406,145 130.7%
 Homework Sourse