Suppose we have a normally distributed dataset with 50000 sc
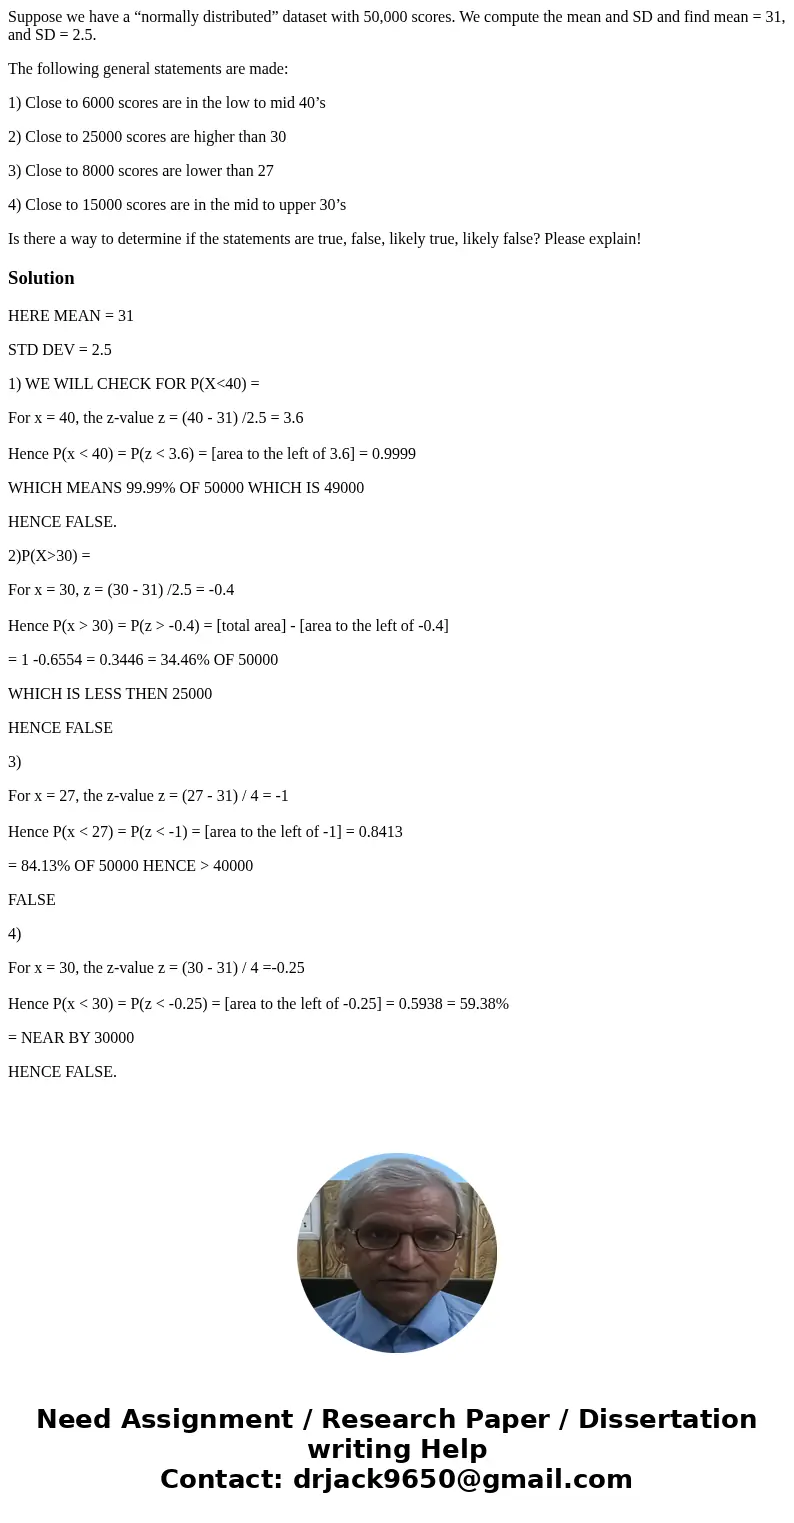
Suppose we have a “normally distributed” dataset with 50,000 scores. We compute the mean and SD and find mean = 31, and SD = 2.5.
The following general statements are made:
1) Close to 6000 scores are in the low to mid 40’s
2) Close to 25000 scores are higher than 30
3) Close to 8000 scores are lower than 27
4) Close to 15000 scores are in the mid to upper 30’s
Is there a way to determine if the statements are true, false, likely true, likely false? Please explain!
Solution
HERE MEAN = 31
STD DEV = 2.5
1) WE WILL CHECK FOR P(X<40) =
For x = 40, the z-value z = (40 - 31) /2.5 = 3.6
Hence P(x < 40) = P(z < 3.6) = [area to the left of 3.6] = 0.9999
WHICH MEANS 99.99% OF 50000 WHICH IS 49000
HENCE FALSE.
2)P(X>30) =
For x = 30, z = (30 - 31) /2.5 = -0.4
Hence P(x > 30) = P(z > -0.4) = [total area] - [area to the left of -0.4]
= 1 -0.6554 = 0.3446 = 34.46% OF 50000
WHICH IS LESS THEN 25000
HENCE FALSE
3)
For x = 27, the z-value z = (27 - 31) / 4 = -1
Hence P(x < 27) = P(z < -1) = [area to the left of -1] = 0.8413
= 84.13% OF 50000 HENCE > 40000
FALSE
4)
For x = 30, the z-value z = (30 - 31) / 4 =-0.25
Hence P(x < 30) = P(z < -0.25) = [area to the left of -0.25] = 0.5938 = 59.38%
= NEAR BY 30000
HENCE FALSE.

 Homework Sourse