Secure httpsedugenwileypluscomedugenstudentmainfruni lackboa
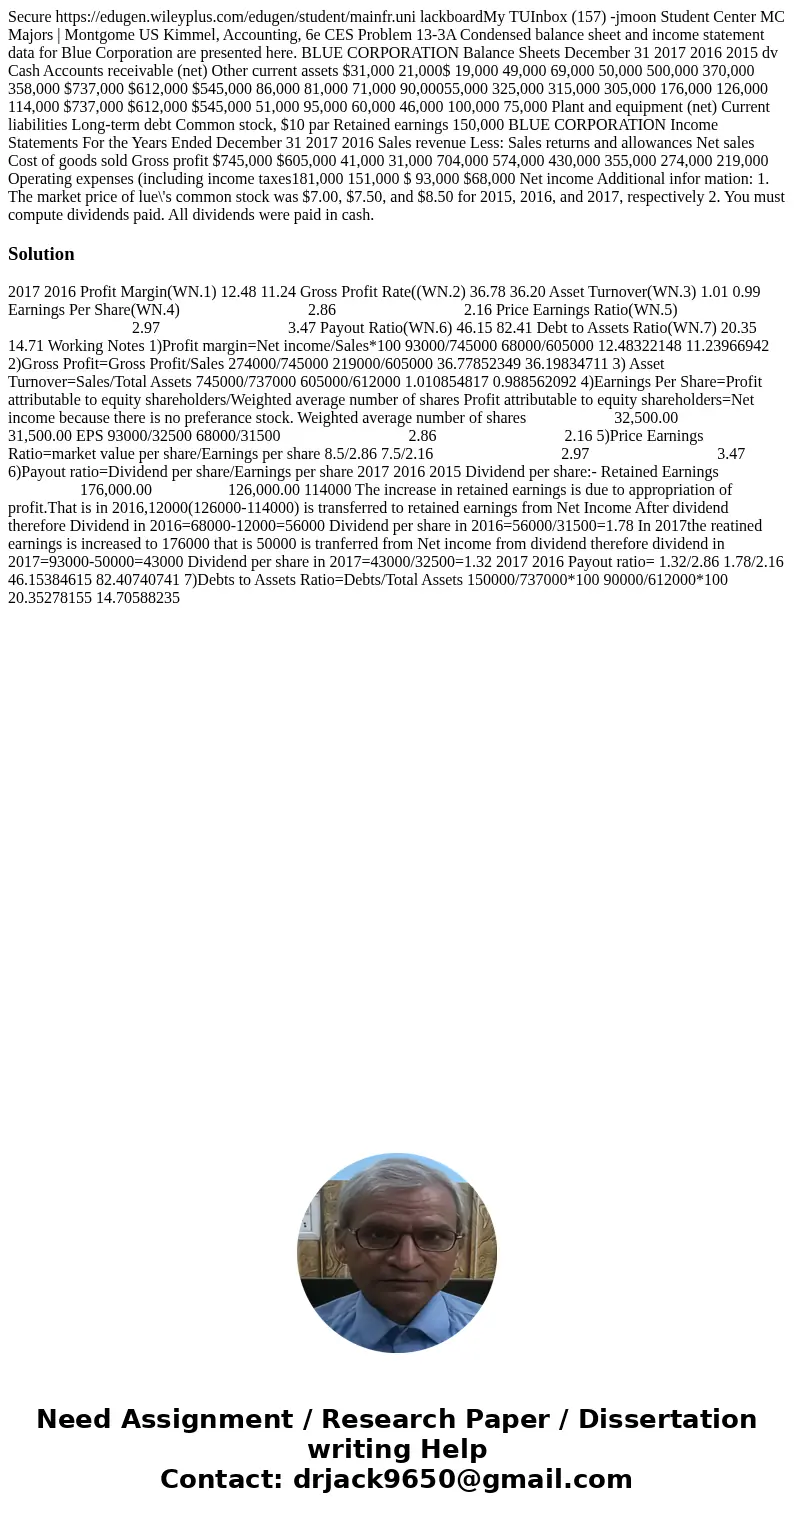
Secure https://edugen.wileyplus.com/edugen/student/mainfr.uni lackboardMy TUInbox (157) -jmoon Student Center MC Majors | Montgome US Kimmel, Accounting, 6e CES Problem 13-3A Condensed balance sheet and income statement data for Blue Corporation are presented here. BLUE CORPORATION Balance Sheets December 31 2017 2016 2015 dv Cash Accounts receivable (net) Other current assets $31,000 21,000$ 19,000 49,000 69,000 50,000 500,000 370,000 358,000 $737,000 $612,000 $545,000 86,000 81,000 71,000 90,00055,000 325,000 315,000 305,000 176,000 126,000 114,000 $737,000 $612,000 $545,000 51,000 95,000 60,000 46,000 100,000 75,000 Plant and equipment (net) Current liabilities Long-term debt Common stock, $10 par Retained earnings 150,000 BLUE CORPORATION Income Statements For the Years Ended December 31 2017 2016 Sales revenue Less: Sales returns and allowances Net sales Cost of goods sold Gross profit $745,000 $605,000 41,000 31,000 704,000 574,000 430,000 355,000 274,000 219,000 Operating expenses (including income taxes181,000 151,000 $ 93,000 $68,000 Net income Additional infor mation: 1. The market price of lue\'s common stock was $7.00, $7.50, and $8.50 for 2015, 2016, and 2017, respectively 2. You must compute dividends paid. All dividends were paid in cash. 
Solution
2017 2016 Profit Margin(WN.1) 12.48 11.24 Gross Profit Rate((WN.2) 36.78 36.20 Asset Turnover(WN.3) 1.01 0.99 Earnings Per Share(WN.4) 2.86 2.16 Price Earnings Ratio(WN.5) 2.97 3.47 Payout Ratio(WN.6) 46.15 82.41 Debt to Assets Ratio(WN.7) 20.35 14.71 Working Notes 1)Profit margin=Net income/Sales*100 93000/745000 68000/605000 12.48322148 11.23966942 2)Gross Profit=Gross Profit/Sales 274000/745000 219000/605000 36.77852349 36.19834711 3) Asset Turnover=Sales/Total Assets 745000/737000 605000/612000 1.010854817 0.988562092 4)Earnings Per Share=Profit attributable to equity shareholders/Weighted average number of shares Profit attributable to equity shareholders=Net income because there is no preferance stock. Weighted average number of shares 32,500.00 31,500.00 EPS 93000/32500 68000/31500 2.86 2.16 5)Price Earnings Ratio=market value per share/Earnings per share 8.5/2.86 7.5/2.16 2.97 3.47 6)Payout ratio=Dividend per share/Earnings per share 2017 2016 2015 Dividend per share:- Retained Earnings 176,000.00 126,000.00 114000 The increase in retained earnings is due to appropriation of profit.That is in 2016,12000(126000-114000) is transferred to retained earnings from Net Income After dividend therefore Dividend in 2016=68000-12000=56000 Dividend per share in 2016=56000/31500=1.78 In 2017the reatined earnings is increased to 176000 that is 50000 is tranferred from Net income from dividend therefore dividend in 2017=93000-50000=43000 Dividend per share in 2017=43000/32500=1.32 2017 2016 Payout ratio= 1.32/2.86 1.78/2.16 46.15384615 82.40740741 7)Debts to Assets Ratio=Debts/Total Assets 150000/737000*100 90000/612000*100 20.35278155 14.70588235
 Homework Sourse