Question one a Fill in the below table and sketch a graph b
Question one a. Fill in the below table and sketch a graph. b. Comment generally on the Marginal Cost and the Average Total Cost Total Fixed Variable Average Marginal Average Fixed Cost Variable cost total cost Cost Average QuantityCost cost 1,105.00 4 1000.00 20.00 5 6 150.00 7 181.00 38.00 8 9 1,264.00 29.3 131.9 10

Solution
Ans 2)
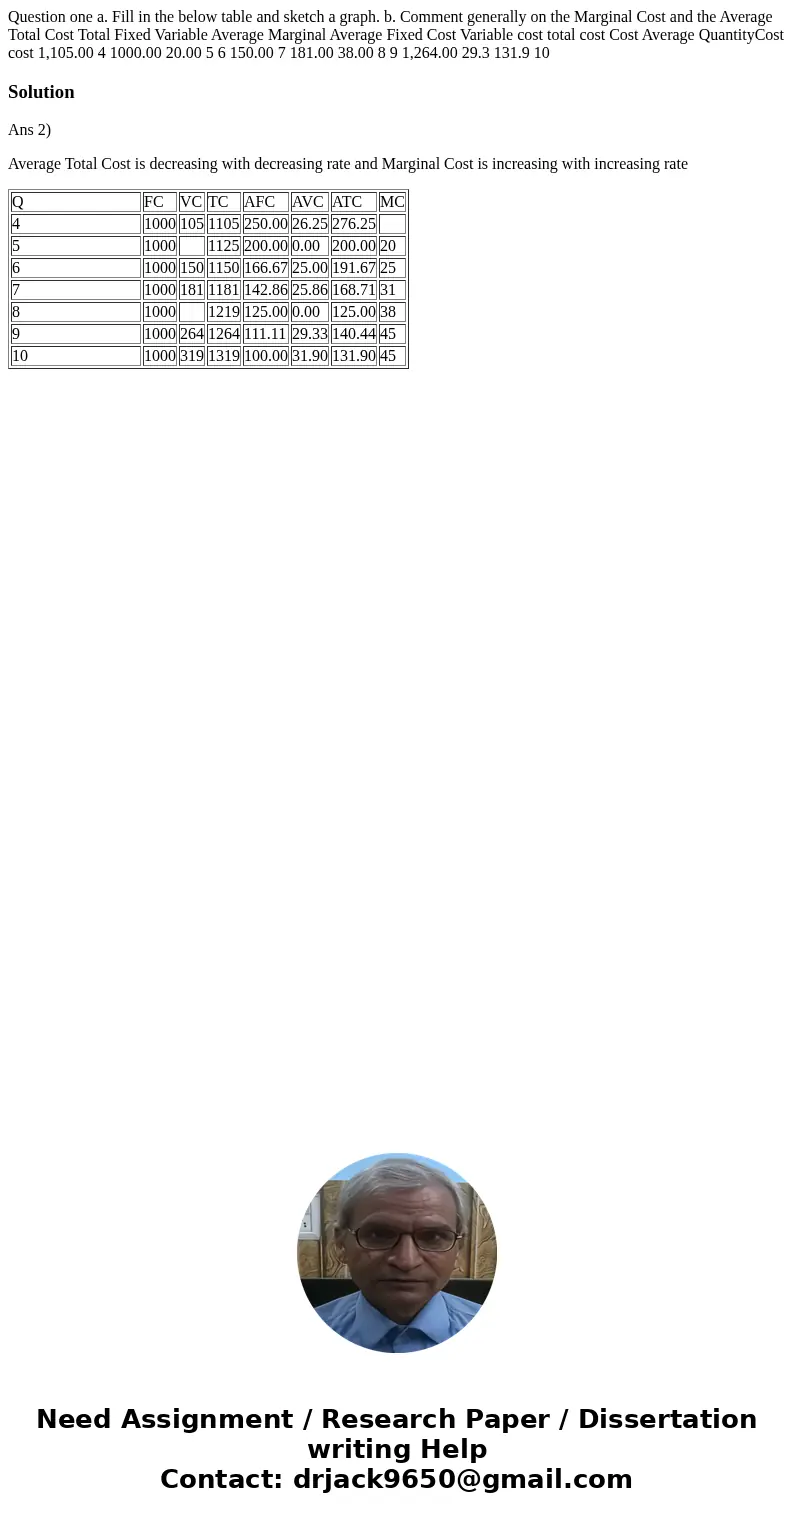
Average Total Cost is decreasing with decreasing rate and Marginal Cost is increasing with increasing rate
| Q | FC | VC | TC | AFC | AVC | ATC | MC |
| 4 | 1000 | 105 | 1105 | 250.00 | 26.25 | 276.25 | |
| 5 | 1000 | 1125 | 200.00 | 0.00 | 200.00 | 20 | |
| 6 | 1000 | 150 | 1150 | 166.67 | 25.00 | 191.67 | 25 |
| 7 | 1000 | 181 | 1181 | 142.86 | 25.86 | 168.71 | 31 |
| 8 | 1000 | 1219 | 125.00 | 0.00 | 125.00 | 38 | |
| 9 | 1000 | 264 | 1264 | 111.11 | 29.33 | 140.44 | 45 |
| 10 | 1000 | 319 | 1319 | 100.00 | 31.90 | 131.90 | 45 |

 Homework Sourse