Po nd lar ie od ite 5 Here are the results of the regression
Solution
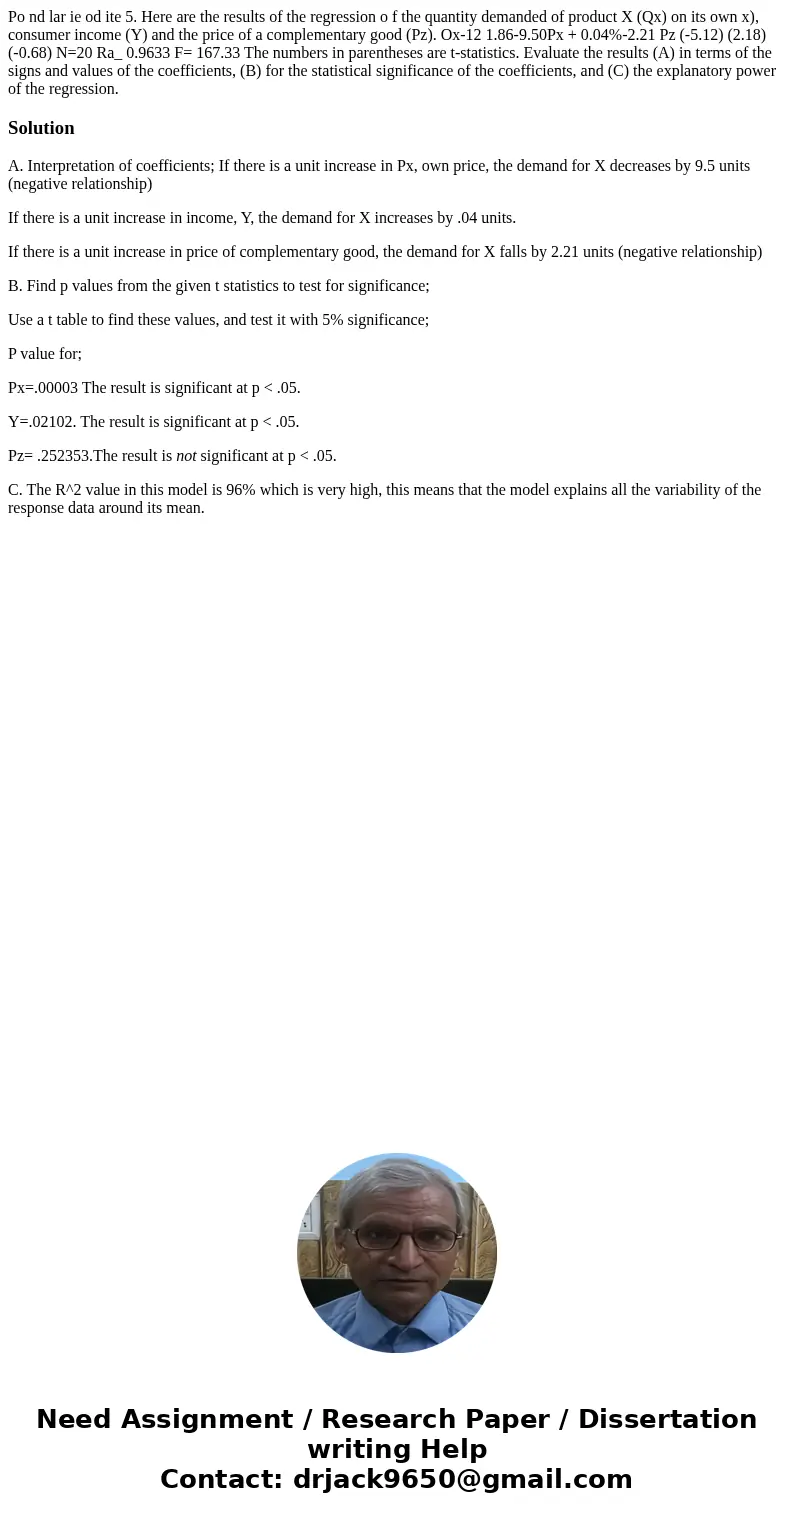
A. Interpretation of coefficients; If there is a unit increase in Px, own price, the demand for X decreases by 9.5 units (negative relationship)
If there is a unit increase in income, Y, the demand for X increases by .04 units.
If there is a unit increase in price of complementary good, the demand for X falls by 2.21 units (negative relationship)
B. Find p values from the given t statistics to test for significance;
Use a t table to find these values, and test it with 5% significance;
P value for;
Px=.00003 The result is significant at p < .05.
Y=.02102. The result is significant at p < .05.
Pz= .252353.The result is not significant at p < .05.
C. The R^2 value in this model is 96% which is very high, this means that the model explains all the variability of the response data around its mean.

 Homework Sourse