Please use the info from the first pic to help me with questions 29-31 on the second pic. Thank you.
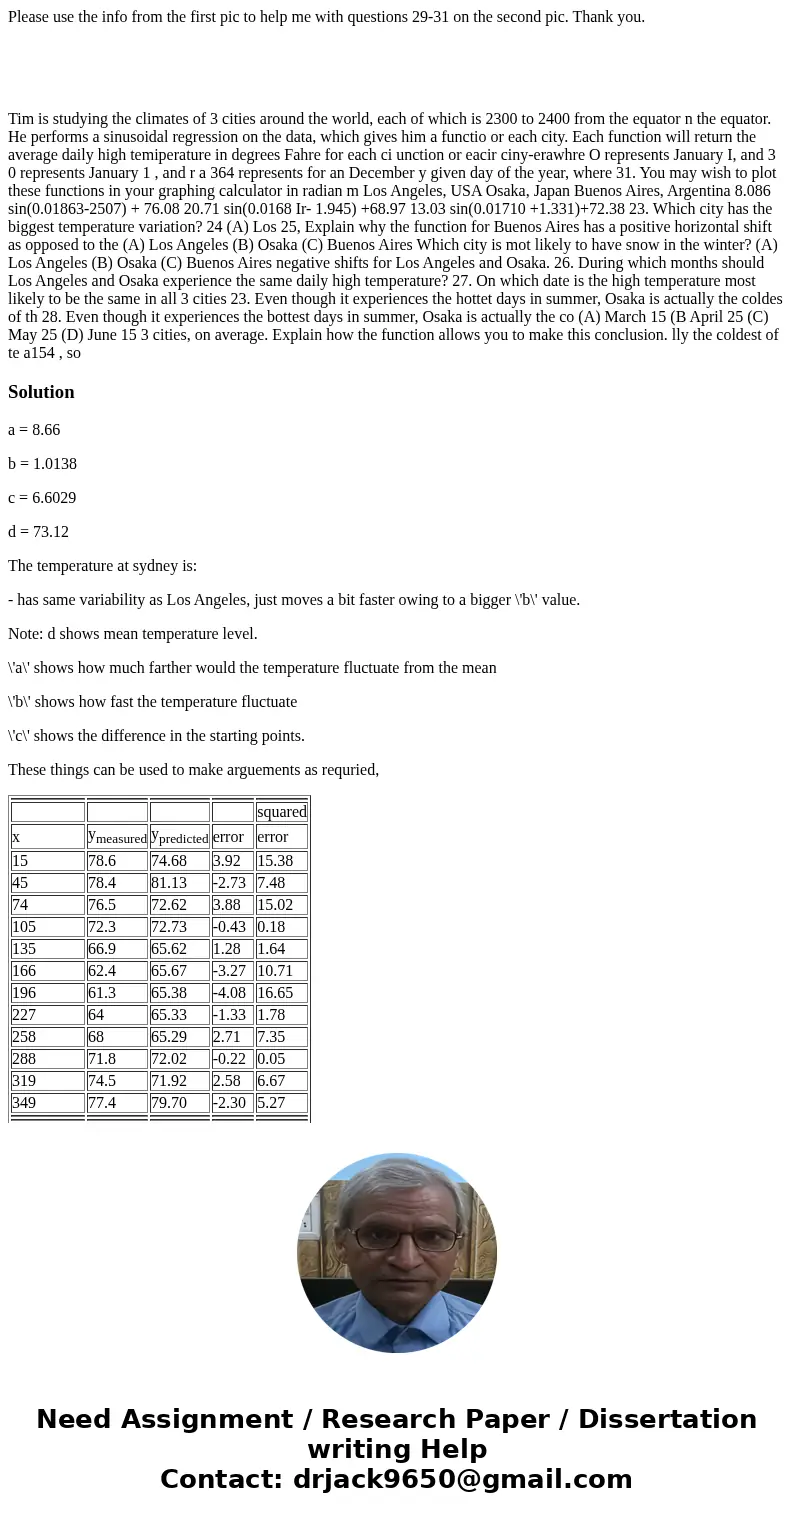
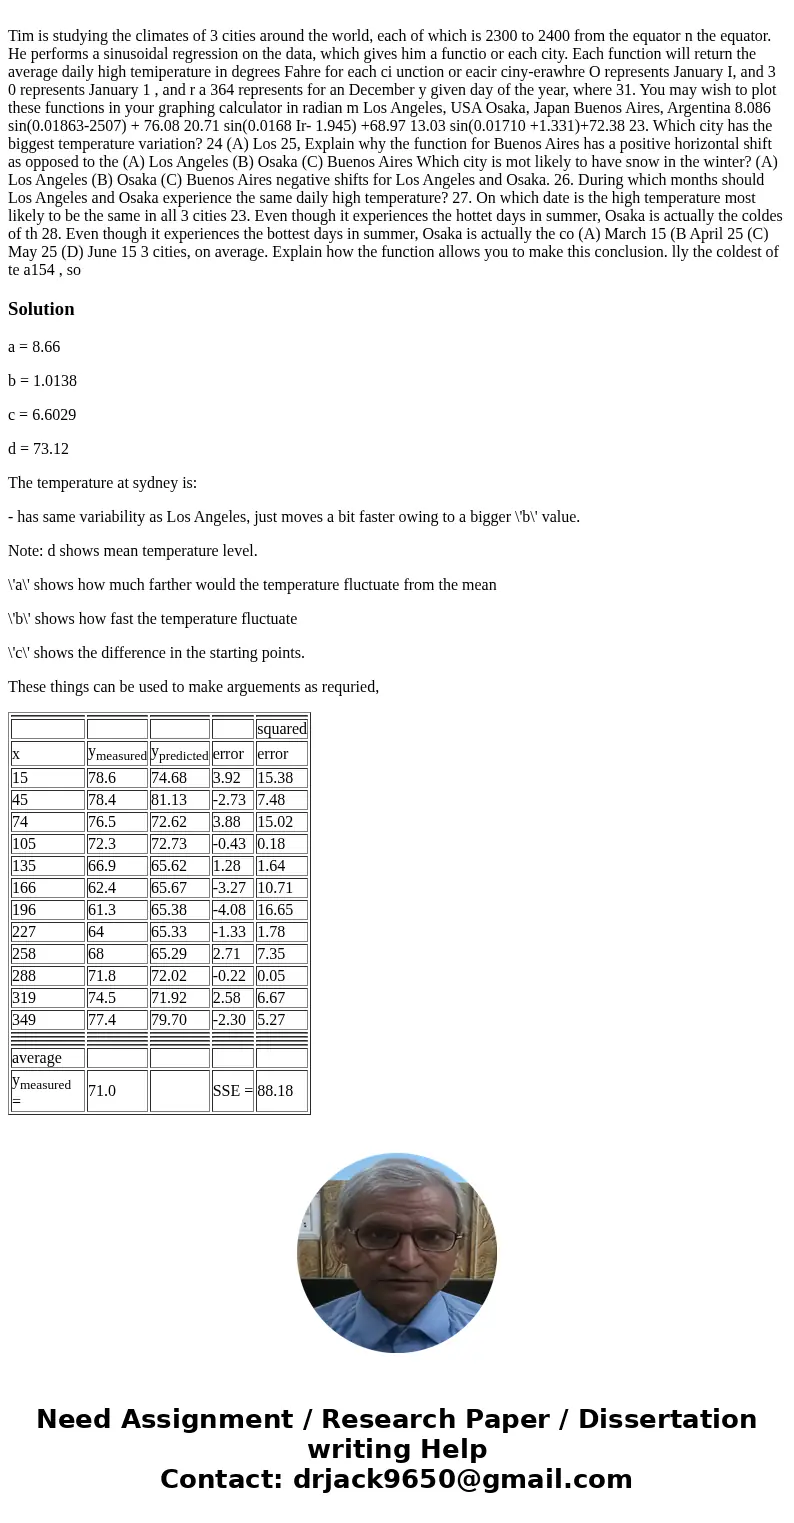
Tim is studying the climates of 3 cities around the world, each of which is 2300 to 2400 from the equator n the equator. He performs a sinusoidal regression on the data, which gives him a functio or each city. Each function will return the average daily high temiperature in degrees Fahre for each ci unction or eacir ciny-erawhre O represents January I, and 3 0 represents January 1 , and r a 364 represents for an December y given day of the year, where 31. You may wish to plot these functions in your graphing calculator in radian m Los Angeles, USA Osaka, Japan Buenos Aires, Argentina 8.086 sin(0.01863-2507) + 76.08 20.71 sin(0.0168 Ir- 1.945) +68.97 13.03 sin(0.01710 +1.331)+72.38 23. Which city has the biggest temperature variation? 24 (A) Los 25, Explain why the function for Buenos Aires has a positive horizontal shift as opposed to the (A) Los Angeles (B) Osaka (C) Buenos Aires Which city is mot likely to have snow in the winter? (A) Los Angeles (B) Osaka (C) Buenos Aires negative shifts for Los Angeles and Osaka. 26. During which months should Los Angeles and Osaka experience the same daily high temperature? 27. On which date is the high temperature most likely to be the same in all 3 cities 23. Even though it experiences the hottet days in summer, Osaka is actually the coldes of th 28. Even though it experiences the bottest days in summer, Osaka is actually the co (A) March 15 (B April 25 (C) May 25 (D) June 15 3 cities, on average. Explain how the function allows you to make this conclusion. lly the coldest of te a154 , so
a = 8.66
b = 1.0138
c = 6.6029
d = 73.12
The temperature at sydney is:
- has same variability as Los Angeles, just moves a bit faster owing to a bigger \'b\' value.
Note: d shows mean temperature level.
\'a\' shows how much farther would the temperature fluctuate from the mean
\'b\' shows how fast the temperature fluctuate
\'c\' shows the difference in the starting points.
These things can be used to make arguements as requried,
| | | | |
| | | | squared |
| x | ymeasured | ypredicted | error | error |
| 15 | 78.6 | 74.68 | 3.92 | 15.38 |
| 45 | 78.4 | 81.13 | -2.73 | 7.48 |
| 74 | 76.5 | 72.62 | 3.88 | 15.02 |
| 105 | 72.3 | 72.73 | -0.43 | 0.18 |
| 135 | 66.9 | 65.62 | 1.28 | 1.64 |
| 166 | 62.4 | 65.67 | -3.27 | 10.71 |
| 196 | 61.3 | 65.38 | -4.08 | 16.65 |
| 227 | 64 | 65.33 | -1.33 | 1.78 |
| 258 | 68 | 65.29 | 2.71 | 7.35 |
| 288 | 71.8 | 72.02 | -0.22 | 0.05 |
| 319 | 74.5 | 71.92 | 2.58 | 6.67 |
| 349 | 77.4 | 79.70 | -2.30 | 5.27 |
| | | | |
| | | | |
| | | | |
| | | | |
| average | | | | |
| ymeasured = | 71.0 | | SSE = | 88.18 |


 Homework Sourse