Dont worry what is Figure 53 in question It just list down a
Don’t worry what is Figure 5.3 in question It just list down all the financial ratios name and formula
Excerpts from the 2012 financial report of Intel, a computer-processor manufacturer, are as follows (dollars in millions). 2012 2011 2010 Balance Sheet Current assets Long-term assets Current liabilities Long-term debt Shareholders\' equity Income Statement Sales Net income Interest expense $31,358 52,993 12,898 20,250 51,203 $25,872 5,247 12,028 13,180 45,911 $31,611 31,575 9,327 4,429 49,430 $53,341 11,005 94 $53,999 12,942 192 $43,623 11,464 109 Review this information, calculate relevant ratios from Figure 5-3, and explain why Intel appears to be a good or poor investment. The tax rate was 26 percent. luded the following financial statements in a loanSolution
Ratio Analysis
2012
2011
2010
current ratio
current assets/current liabilities
2.43
2.15
3.39
current assets
31358
25872
31611
current liabilities
12898
12028
9327
2012
2011
2010
net profit ratio
net income/sales
20.63%
23.97%
26.28%
Net income
11005
12942
11464
sales
53341
53999
43623
2012
2011
2010
return on equity
net income/total of equity
21.49%
28.19%
23.19%
Net income
11005
12942
11464
total of equity
51203
45911
49430
2012
2011
2010
return on assets
net income/total assets
13.05%
18.20%
18.14%
Net income
11005
12942
11464
total assets = current assets+long term assets
84351
71119
63186
Debt ratio
total of liabilities/total equity
0.65
0.55
0.28
total of liabilities = current liabilities+long term debt
33148
25208
13756
total of equity
51203
45911
49430
profit before tax
net income/(1-income tax rate)
14871.62
17489.19
15491.89
EBIT
profit before tax+interest
14965.62
17681.19
15600.89
Interest
94
192
109
Interest coverage ratio
EBIT/interest
159.21
92.09
143.13
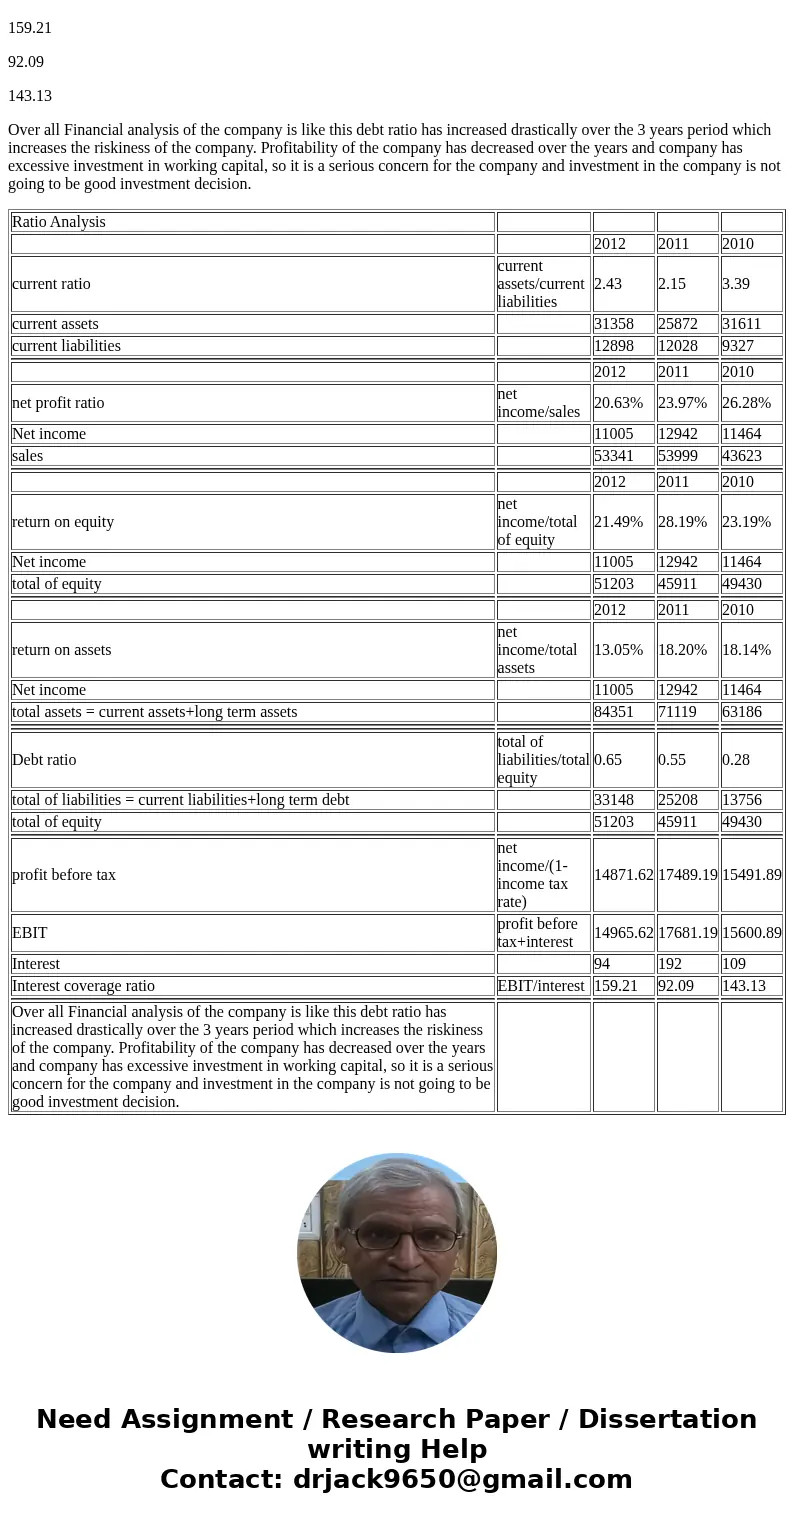
Over all Financial analysis of the company is like this debt ratio has increased drastically over the 3 years period which increases the riskiness of the company. Profitability of the company has decreased over the years and company has excessive investment in working capital, so it is a serious concern for the company and investment in the company is not going to be good investment decision.
| Ratio Analysis | ||||
| 2012 | 2011 | 2010 | ||
| current ratio | current assets/current liabilities | 2.43 | 2.15 | 3.39 |
| current assets | 31358 | 25872 | 31611 | |
| current liabilities | 12898 | 12028 | 9327 | |
| 2012 | 2011 | 2010 | ||
| net profit ratio | net income/sales | 20.63% | 23.97% | 26.28% |
| Net income | 11005 | 12942 | 11464 | |
| sales | 53341 | 53999 | 43623 | |
| 2012 | 2011 | 2010 | ||
| return on equity | net income/total of equity | 21.49% | 28.19% | 23.19% |
| Net income | 11005 | 12942 | 11464 | |
| total of equity | 51203 | 45911 | 49430 | |
| 2012 | 2011 | 2010 | ||
| return on assets | net income/total assets | 13.05% | 18.20% | 18.14% |
| Net income | 11005 | 12942 | 11464 | |
| total assets = current assets+long term assets | 84351 | 71119 | 63186 | |
| Debt ratio | total of liabilities/total equity | 0.65 | 0.55 | 0.28 |
| total of liabilities = current liabilities+long term debt | 33148 | 25208 | 13756 | |
| total of equity | 51203 | 45911 | 49430 | |
| profit before tax | net income/(1-income tax rate) | 14871.62 | 17489.19 | 15491.89 |
| EBIT | profit before tax+interest | 14965.62 | 17681.19 | 15600.89 |
| Interest | 94 | 192 | 109 | |
| Interest coverage ratio | EBIT/interest | 159.21 | 92.09 | 143.13 |
| Over all Financial analysis of the company is like this debt ratio has increased drastically over the 3 years period which increases the riskiness of the company. Profitability of the company has decreased over the years and company has excessive investment in working capital, so it is a serious concern for the company and investment in the company is not going to be good investment decision. |
 Homework Sourse