Based on Table 4 which variable accounted for the most varia
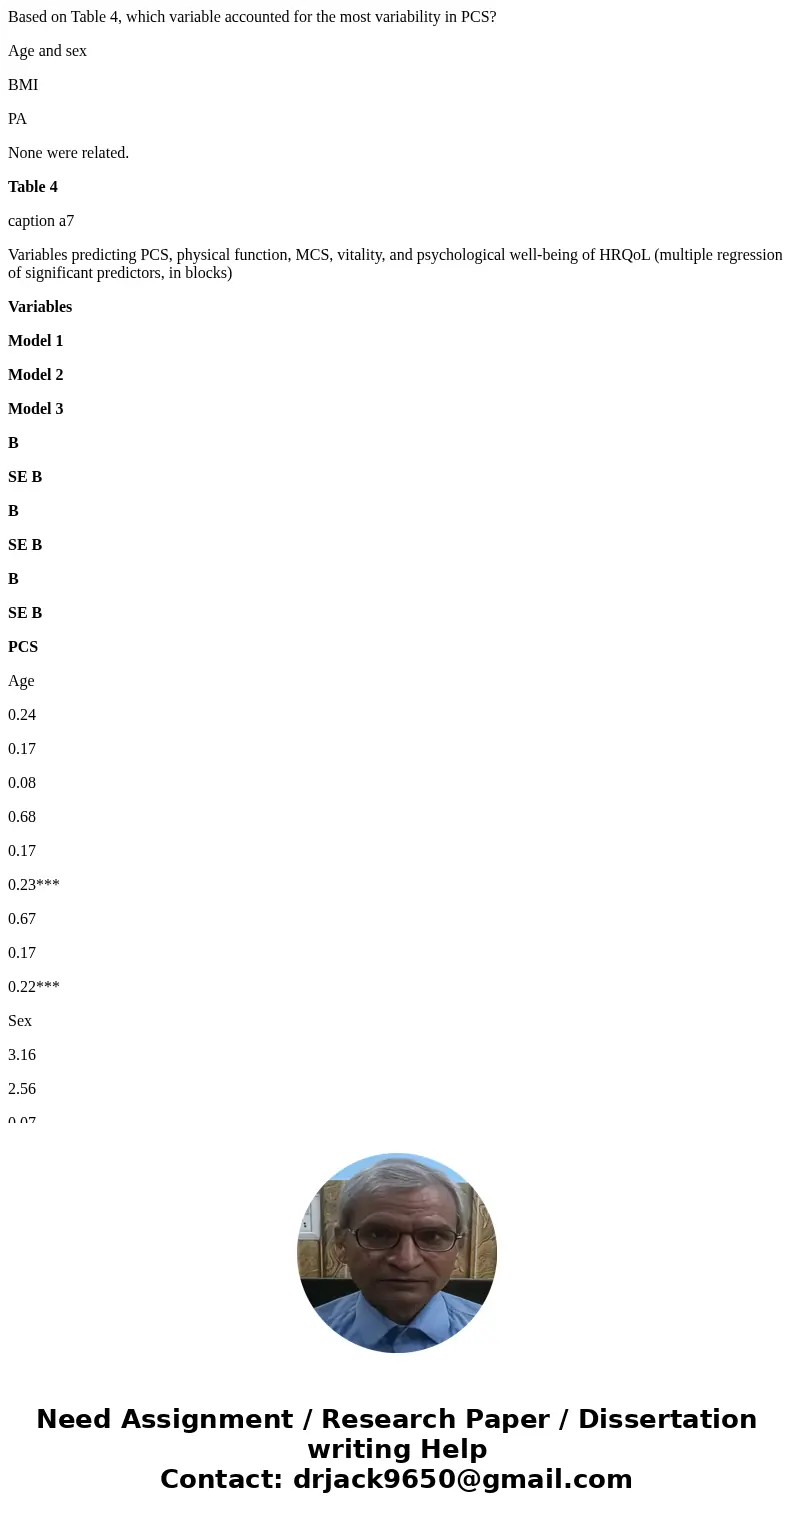
Based on Table 4, which variable accounted for the most variability in PCS?
Age and sex
BMI
PA
None were related.
Table 4
caption a7
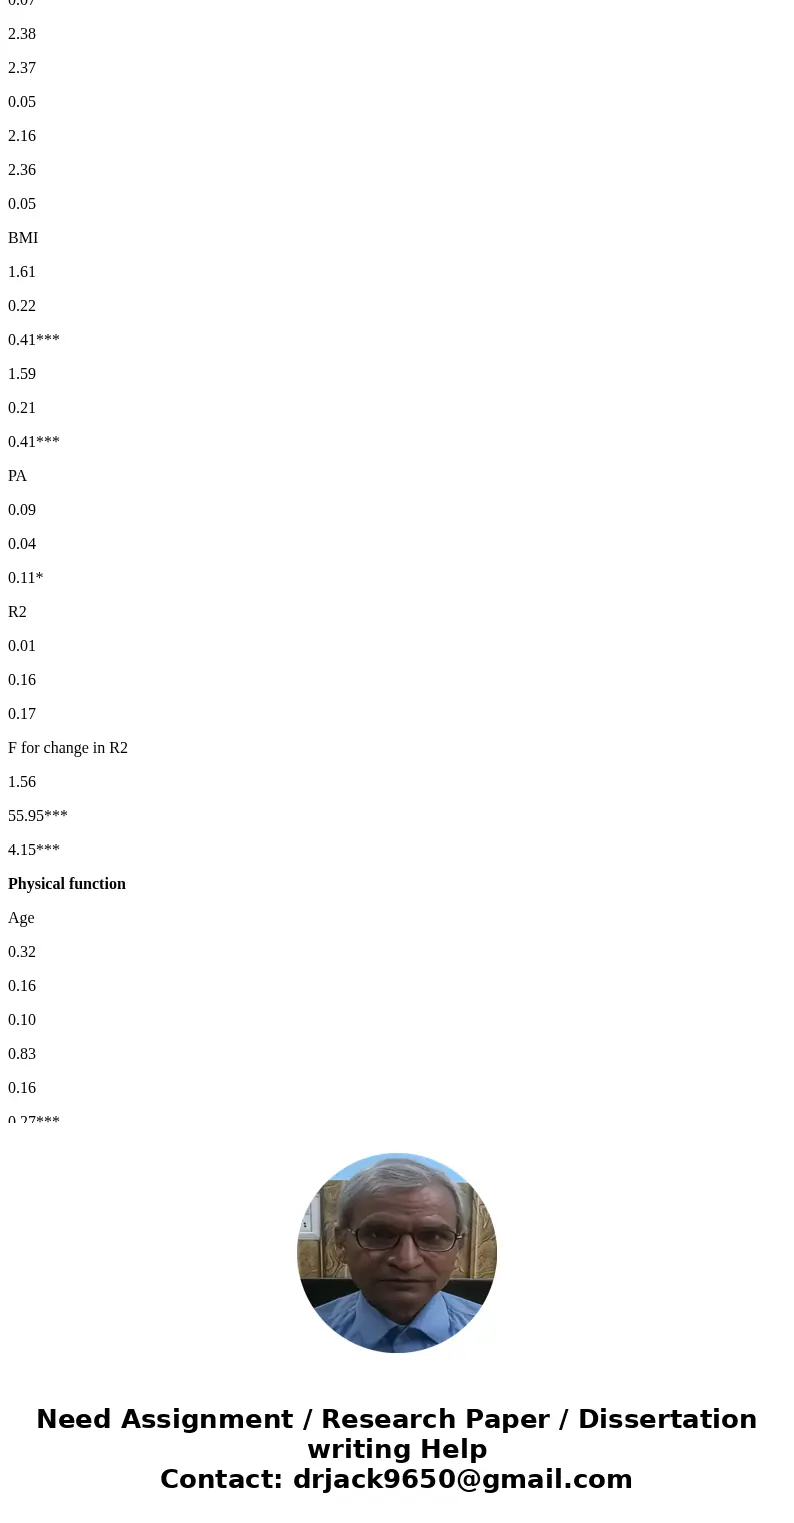
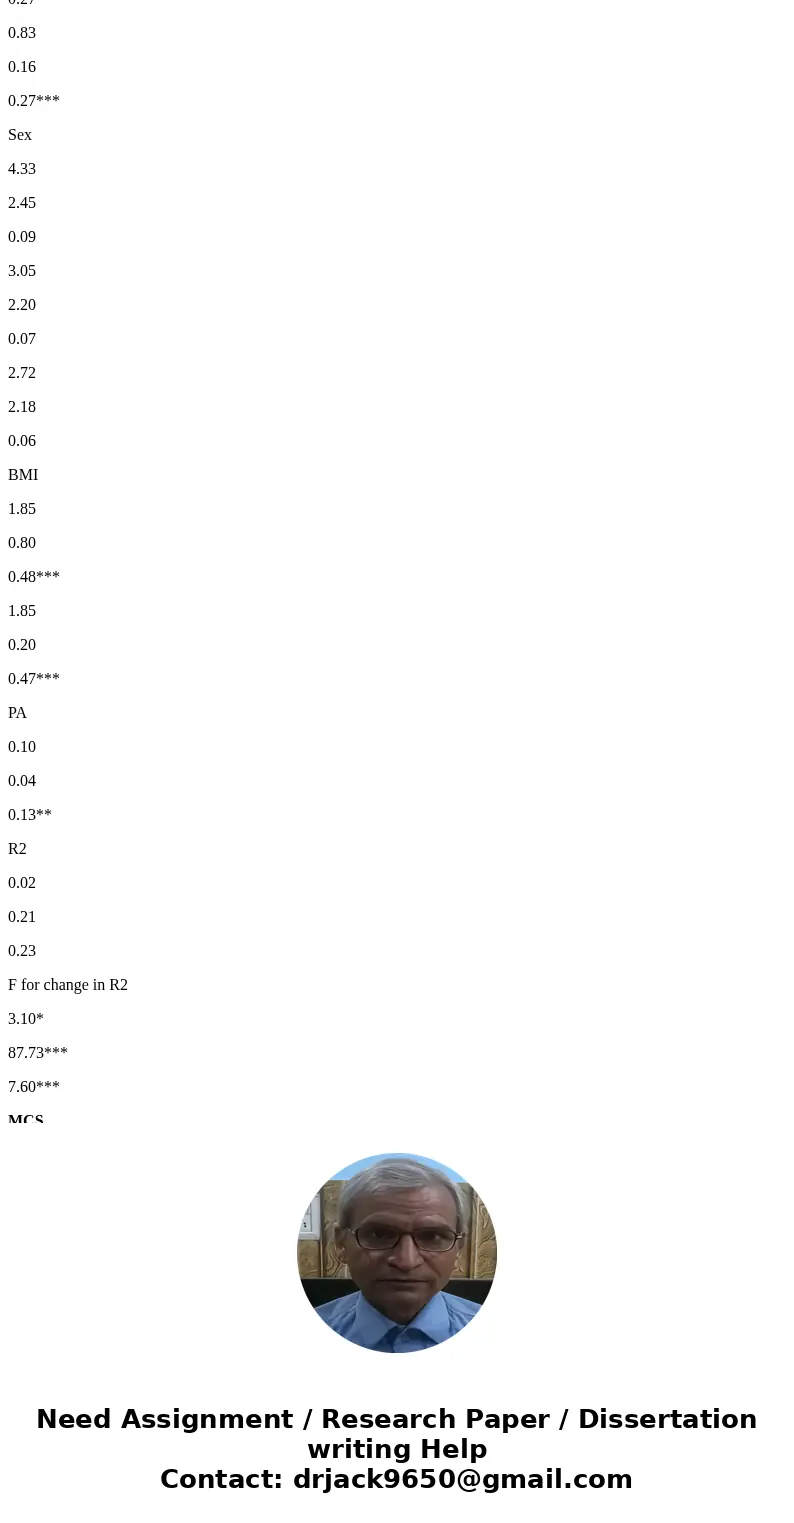
Variables predicting PCS, physical function, MCS, vitality, and psychological well-being of HRQoL (multiple regression of significant predictors, in blocks)
Variables
Model 1
Model 2
Model 3
B
SE B
B
SE B
B
SE B
PCS
Age
0.24
0.17
0.08
0.68
0.17
0.23***
0.67
0.17
0.22***
Sex
3.16
2.56
0.07
2.38
2.37
0.05
2.16
2.36
0.05
BMI
1.61
0.22
0.41***
1.59
0.21
0.41***
PA
0.09
0.04
0.11*
R2
0.01
0.16
0.17
F for change in R2
1.56
55.95***
4.15***
Physical function
Age
0.32
0.16
0.10
0.83
0.16
0.27***
0.83
0.16
0.27***
Sex
4.33
2.45
0.09
3.05
2.20
0.07
2.72
2.18
0.06
BMI
1.85
0.80
0.48***
1.85
0.20
0.47***
PA
0.10
0.04
0.13**
R2
0.02
0.21
0.23
F for change in R2
3.10*
87.73***
7.60***
MCS
Age
0.02
0.15
0.01
0.21
0.16
0.08
0.21
0.16
0.08
Sex
4.91
2.34
0.12*
4.61
2.21
0.11*
4.06
2.24
0.10
BMI
0.84
0.21
0.24**
0.81
0.20
0.23**
PA
0.13
0.04
0.20***
R2
0.02
0.07
0.10
F for change in R2
2.29
16.71***
13.20***
Vitality
Age
0.26
0.14
0.11
0.03
0.14
0.01
0.04
0.14
0.02
Sex
2.92
2.02
0.08
2.35
1.96
0.06
1.84
1.91
0.05
BMI
0.84
0.18
0.27***
0.81
0.17
0.24***
PA
0.15
0.03
0.24***
R2
0.02
0.08
0.14
F for change in R2
3.34*
22.28***
22.03***
Psychological well-being
Age
0.23
0.14
0.09
0.11
0.14
0.05
0.12
0.14
0.05
Sex
2.91
2.03
0.08
2.70
2.02
0.07
2.30
2.00
0.06
BMI
0.41
0.18
0.13*
0.39
0.18
0.13*
PA
0.11
0.03
0.18**
R2
0.02
0.03
0.06
F for change in R2
2.71
4.98*
11.32*
Notes:
*P < 0.05 level;
**P < 0.01 level;
***P < 0.001 level (2-tailed).
Abbreviations: BMI, body mass index; HRQoL, health-related quality of life; MCS, mental composite summary; PA, physical activity; PCS, physical composite summary
| A. | Age and sex | |
| B. | BMI | |
| C. | PA | |
| D. | None were related. |
Solution
Age and sex
 Homework Sourse