PLEASE HELP ASAP WILL RATE The blue boxes are the questions
PLEASE HELP ASAP! WILL RATE! (The blue boxes are the questions to solve)
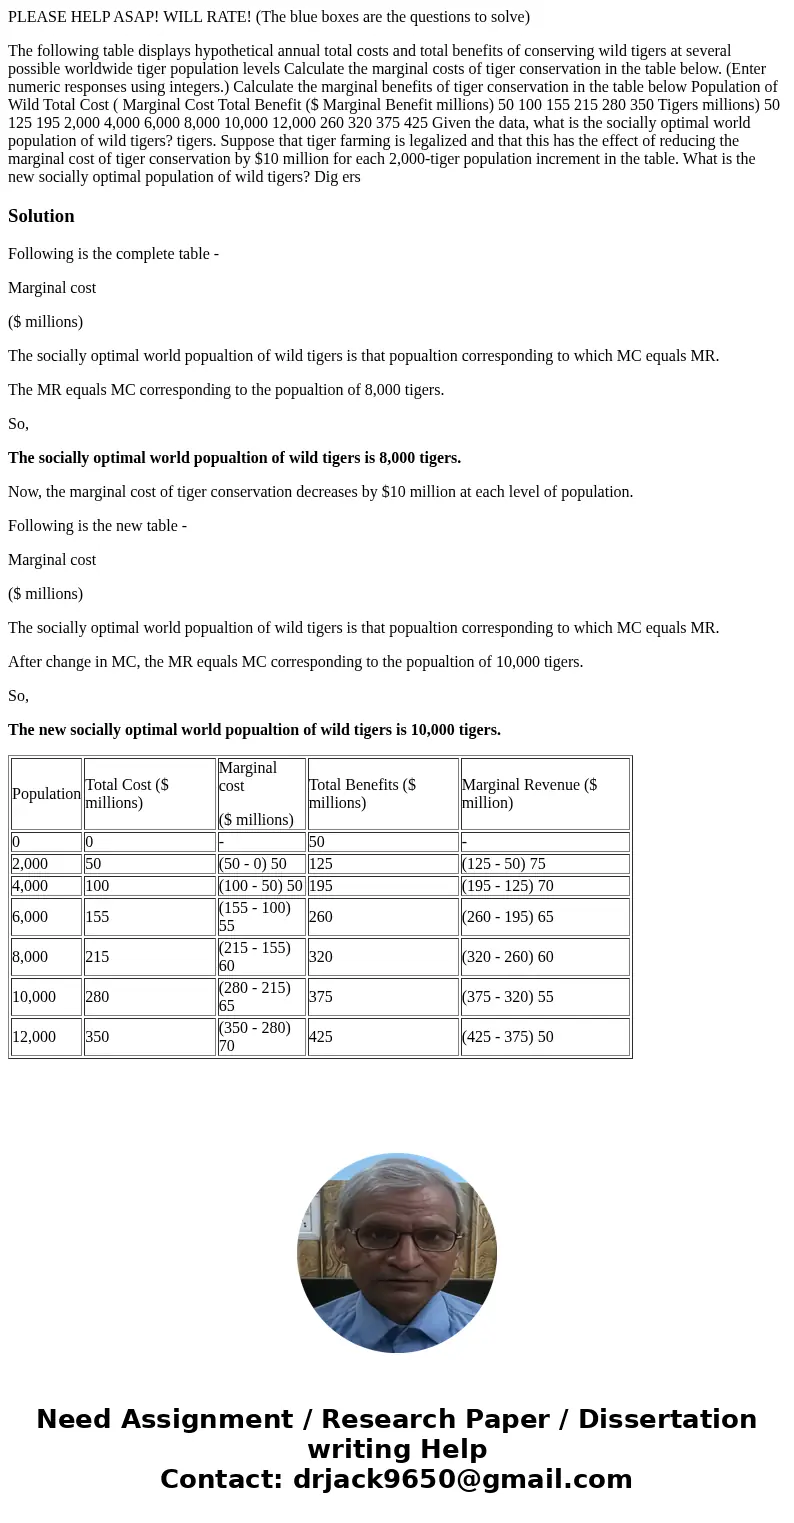
The following table displays hypothetical annual total costs and total benefits of conserving wild tigers at several possible worldwide tiger population levels Calculate the marginal costs of tiger conservation in the table below. (Enter numeric responses using integers.) Calculate the marginal benefits of tiger conservation in the table below Population of Wild Total Cost ( Marginal Cost Total Benefit ($ Marginal Benefit millions) 50 100 155 215 280 350 Tigers millions) 50 125 195 2,000 4,000 6,000 8,000 10,000 12,000 260 320 375 425 Given the data, what is the socially optimal world population of wild tigers? tigers. Suppose that tiger farming is legalized and that this has the effect of reducing the marginal cost of tiger conservation by $10 million for each 2,000-tiger population increment in the table. What is the new socially optimal population of wild tigers? Dig ersSolution
Following is the complete table -
Marginal cost
($ millions)
The socially optimal world popualtion of wild tigers is that popualtion corresponding to which MC equals MR.
The MR equals MC corresponding to the popualtion of 8,000 tigers.
So,
The socially optimal world popualtion of wild tigers is 8,000 tigers.
Now, the marginal cost of tiger conservation decreases by $10 million at each level of population.
Following is the new table -
Marginal cost
($ millions)
The socially optimal world popualtion of wild tigers is that popualtion corresponding to which MC equals MR.
After change in MC, the MR equals MC corresponding to the popualtion of 10,000 tigers.
So,
The new socially optimal world popualtion of wild tigers is 10,000 tigers.
| Population | Total Cost ($ millions) | Marginal cost ($ millions) | Total Benefits ($ millions) | Marginal Revenue ($ million) |
| 0 | 0 | - | 50 | - |
| 2,000 | 50 | (50 - 0) 50 | 125 | (125 - 50) 75 |
| 4,000 | 100 | (100 - 50) 50 | 195 | (195 - 125) 70 |
| 6,000 | 155 | (155 - 100) 55 | 260 | (260 - 195) 65 |
| 8,000 | 215 | (215 - 155) 60 | 320 | (320 - 260) 60 |
| 10,000 | 280 | (280 - 215) 65 | 375 | (375 - 320) 55 |
| 12,000 | 350 | (350 - 280) 70 | 425 | (425 - 375) 50 |

 Homework Sourse