Ch 13 Financial Statemen x eztomheducationcomhmtpx Apps Q
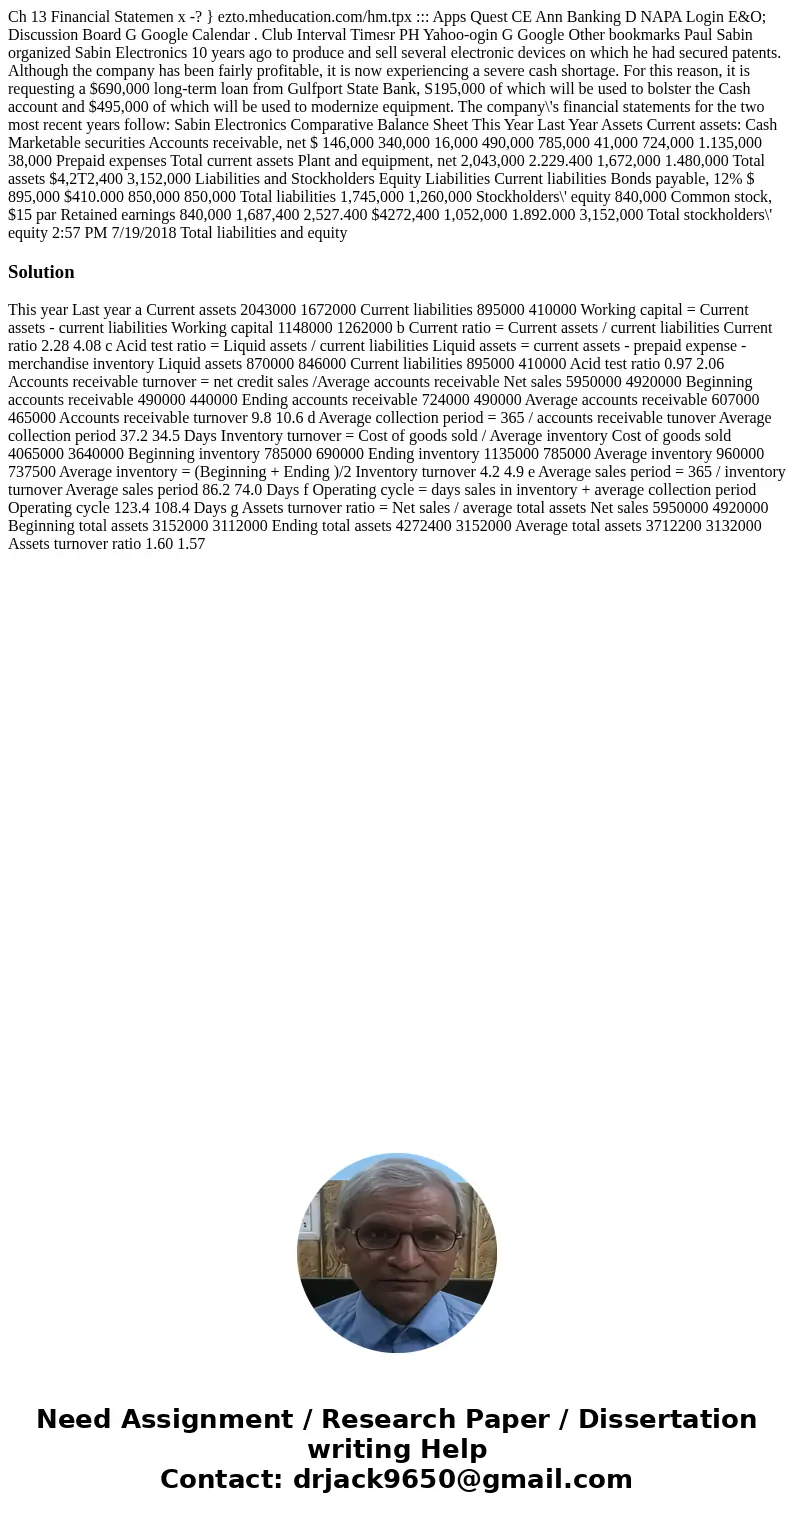
Ch 13 Financial Statemen x -? } ezto.mheducation.com/hm.tpx ::: Apps Quest CE Ann Banking D NAPA Login E&O; Discussion Board G Google Calendar . Club Interval Timesr PH Yahoo-ogin G Google Other bookmarks Paul Sabin organized Sabin Electronics 10 years ago to produce and sell several electronic devices on which he had secured patents. Although the company has been fairly profitable, it is now experiencing a severe cash shortage. For this reason, it is requesting a $690,000 long-term loan from Gulfport State Bank, S195,000 of which will be used to bolster the Cash account and $495,000 of which will be used to modernize equipment. The company\'s financial statements for the two most recent years follow: Sabin Electronics Comparative Balance Sheet This Year Last Year Assets Current assets: Cash Marketable securities Accounts receivable, net $ 146,000 340,000 16,000 490,000 785,000 41,000 724,000 1.135,000 38,000 Prepaid expenses Total current assets Plant and equipment, net 2,043,000 2.229.400 1,672,000 1.480,000 Total assets $4,2T2,400 3,152,000 Liabilities and Stockholders Equity Liabilities Current liabilities Bonds payable, 12% $ 895,000 $410.000 850,000 850,000 Total liabilities 1,745,000 1,260,000 Stockholders\' equity 840,000 Common stock, $15 par Retained earnings 840,000 1,687,400 2,527.400 $4272,400 1,052,000 1.892.000 3,152,000 Total stockholders\' equity 2:57 PM 7/19/2018 Total liabilities and equity 
Solution
This year Last year a Current assets 2043000 1672000 Current liabilities 895000 410000 Working capital = Current assets - current liabilities Working capital 1148000 1262000 b Current ratio = Current assets / current liabilities Current ratio 2.28 4.08 c Acid test ratio = Liquid assets / current liabilities Liquid assets = current assets - prepaid expense - merchandise inventory Liquid assets 870000 846000 Current liabilities 895000 410000 Acid test ratio 0.97 2.06 Accounts receivable turnover = net credit sales /Average accounts receivable Net sales 5950000 4920000 Beginning accounts receivable 490000 440000 Ending accounts receivable 724000 490000 Average accounts receivable 607000 465000 Accounts receivable turnover 9.8 10.6 d Average collection period = 365 / accounts receivable tunover Average collection period 37.2 34.5 Days Inventory turnover = Cost of goods sold / Average inventory Cost of goods sold 4065000 3640000 Beginning inventory 785000 690000 Ending inventory 1135000 785000 Average inventory 960000 737500 Average inventory = (Beginning + Ending )/2 Inventory turnover 4.2 4.9 e Average sales period = 365 / inventory turnover Average sales period 86.2 74.0 Days f Operating cycle = days sales in inventory + average collection period Operating cycle 123.4 108.4 Days g Assets turnover ratio = Net sales / average total assets Net sales 5950000 4920000 Beginning total assets 3152000 3112000 Ending total assets 4272400 3152000 Average total assets 3712200 3132000 Assets turnover ratio 1.60 1.57
 Homework Sourse