The income statements for Federer Sports Apparel for 2019 an
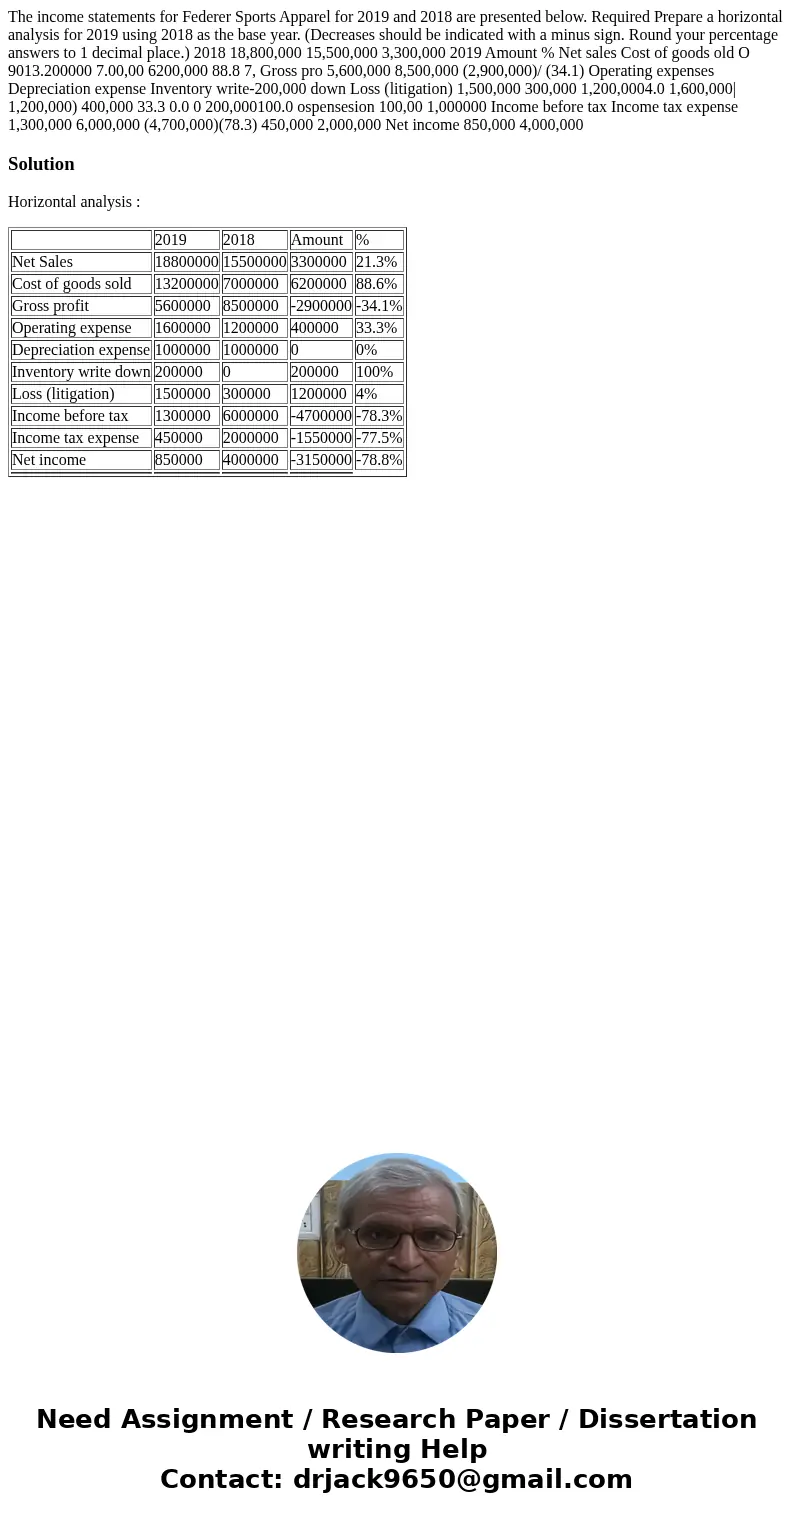
The income statements for Federer Sports Apparel for 2019 and 2018 are presented below. Required Prepare a horizontal analysis for 2019 using 2018 as the base year. (Decreases should be indicated with a minus sign. Round your percentage answers to 1 decimal place.) 2018 18,800,000 15,500,000 3,300,000 2019 Amount % Net sales Cost of goods old O 9013.200000 7.00,00 6200,000 88.8 7, Gross pro 5,600,000 8,500,000 (2,900,000)/ (34.1) Operating expenses Depreciation expense Inventory write-200,000 down Loss (litigation) 1,500,000 300,000 1,200,0004.0 1,600,000| 1,200,000) 400,000 33.3 0.0 0 200,000100.0 ospensesion 100,00 1,000000 Income before tax Income tax expense 1,300,000 6,000,000 (4,700,000)(78.3) 450,000 2,000,000 Net income 850,000 4,000,000

Solution
Horizontal analysis :
| 2019 | 2018 | Amount | % | |
| Net Sales | 18800000 | 15500000 | 3300000 | 21.3% |
| Cost of goods sold | 13200000 | 7000000 | 6200000 | 88.6% |
| Gross profit | 5600000 | 8500000 | -2900000 | -34.1% |
| Operating expense | 1600000 | 1200000 | 400000 | 33.3% |
| Depreciation expense | 1000000 | 1000000 | 0 | 0% |
| Inventory write down | 200000 | 0 | 200000 | 100% |
| Loss (litigation) | 1500000 | 300000 | 1200000 | 4% |
| Income before tax | 1300000 | 6000000 | -4700000 | -78.3% |
| Income tax expense | 450000 | 2000000 | -1550000 | -77.5% |
| Net income | 850000 | 4000000 | -3150000 | -78.8% |

 Homework Sourse