Refer to the civilian unemployment rate for the same two qua
Refer to the civilian unemployment rate for the same two quarters (link: https://fred.stlouisfed.org/graph/?g=dWus). What was the corresponding increase in unemployment over this period?
Solution
Date
UNRATE
Month
Year
Quarters
Average Unemployment rate
Change in unemployment
2016-01-01
4.9
January
2016
Q1
2016-02-01
4.9
February
2016
Q1
2016-03-01
5.0
March
2016
Q1
4.9
2016-04-01
5.0
April
2016
Q2
2016-05-01
4.7
May
2016
Q2
2016-06-01
4.9
June
2016
Q2
2016-07-01
4.9
July
2016
Q3
2016-08-01
4.9
August
2016
Q3
2016-09-01
5.0
September
2016
Q3
2016-10-01
4.9
October
2016
Q4
2016-11-01
4.6
November
2016
Q4
2016-12-01
4.7
December
2016
Q4
2017-01-01
4.8
January
2017
Q1
2017-02-01
4.7
February
2017
Q1
2017-03-01
4.5
March
2017
Q1
4.7
-5.41%
2017-04-01
4.4
April
2017
Q2
2017-05-01
4.3
May
2017
Q2
2017-06-01
4.3
June
2017
Q2
2017-07-01
4.3
July
2017
Q3
2017-08-01
4.4
August
2017
Q3
2017-09-01
4.2
September
2017
Q3
2017-10-01
4.1
October
2017
Q4
2017-11-01
4.1
November
2017
Q4
2017-12-01
4.1
December
2017
Q4
2018-01-01
4.1
January
2018
Q1
2018-02-01
4.1
February
2018
Q1
2018-03-01
4.1
March
2018
Q1
4.1
-12.14%
2018-04-01
3.9
April
2018
Q2
2018-05-01
3.8
May
2018
Q2
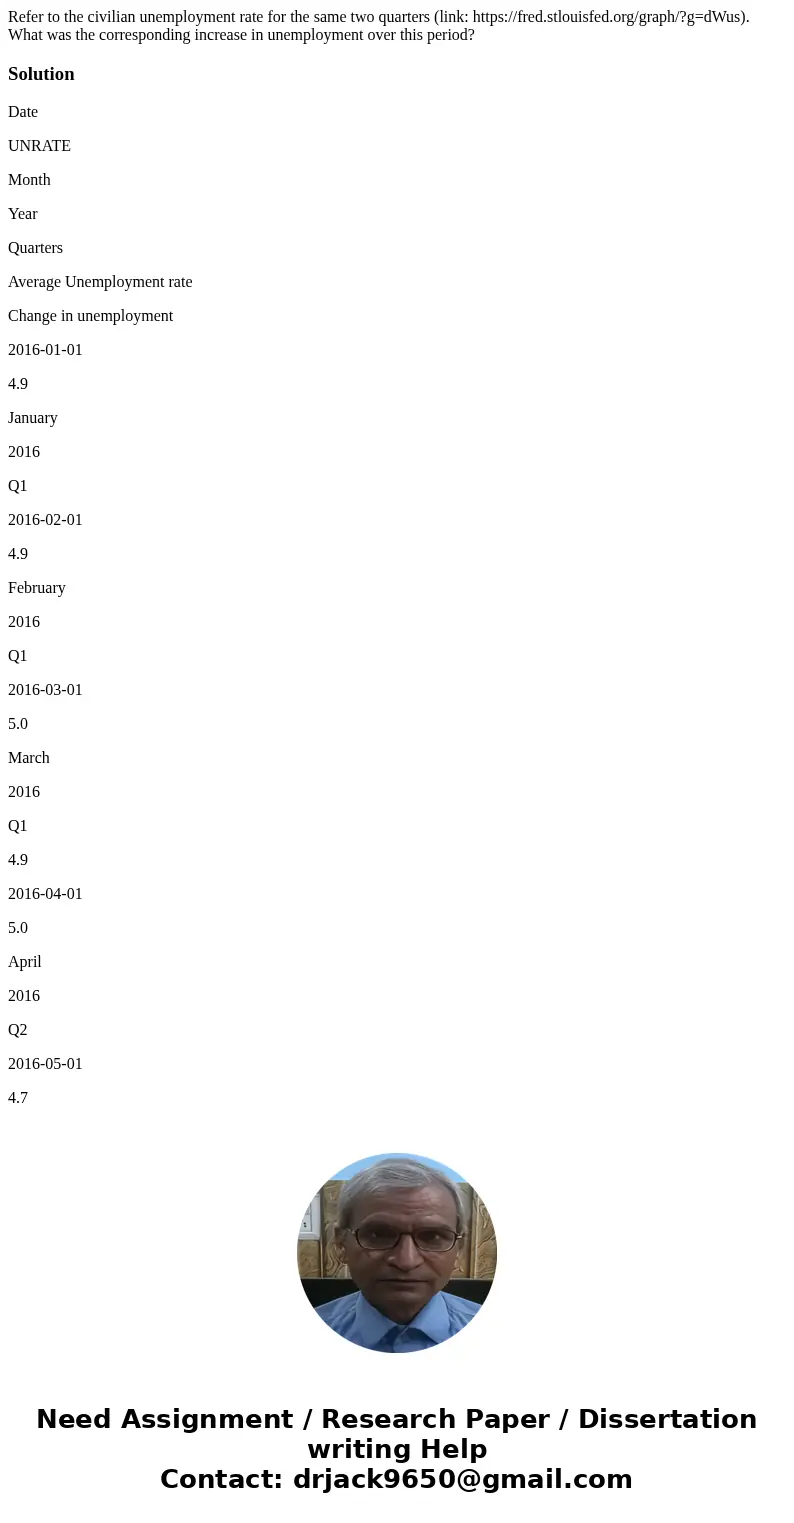
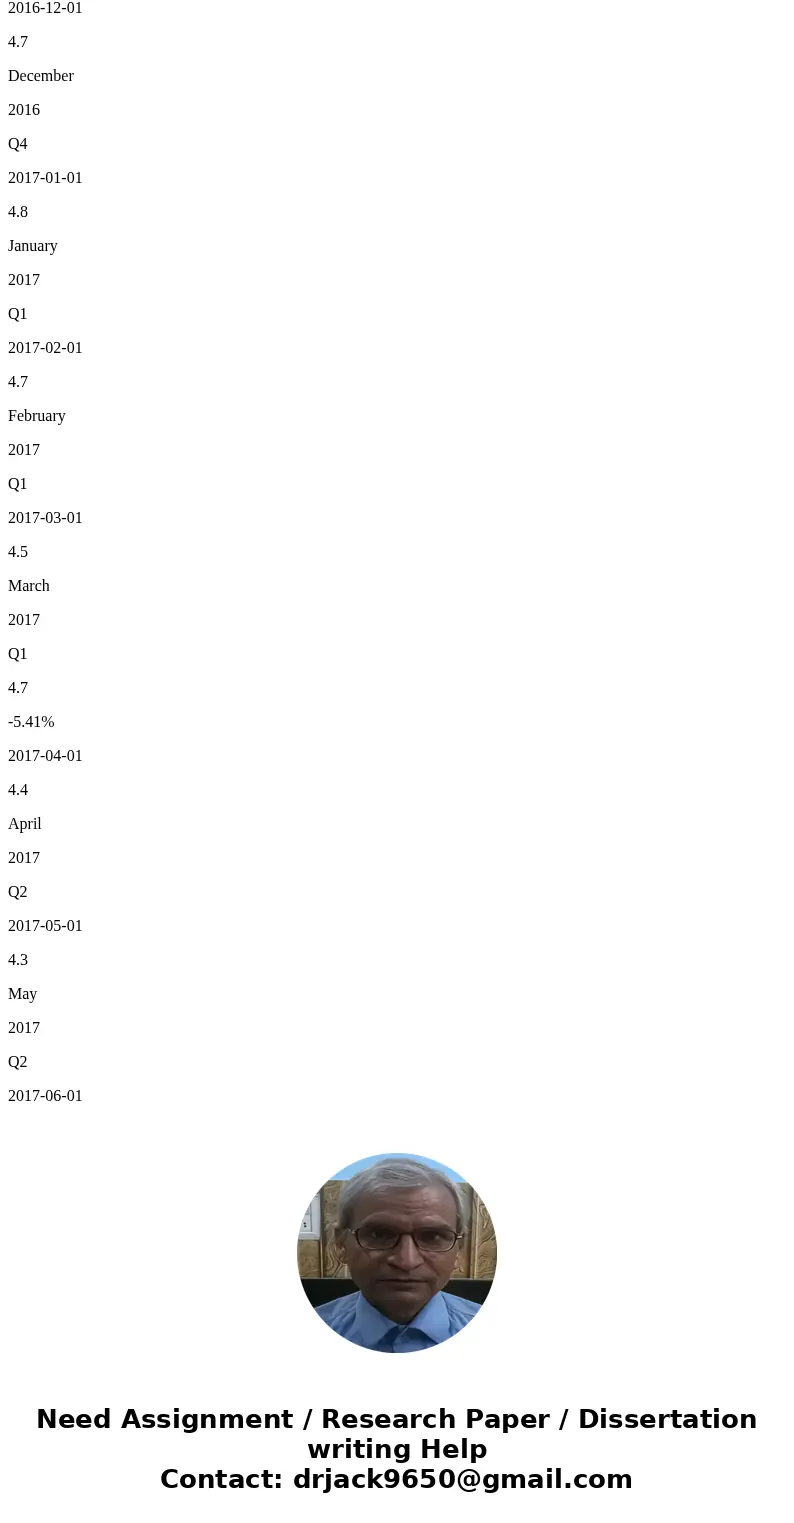
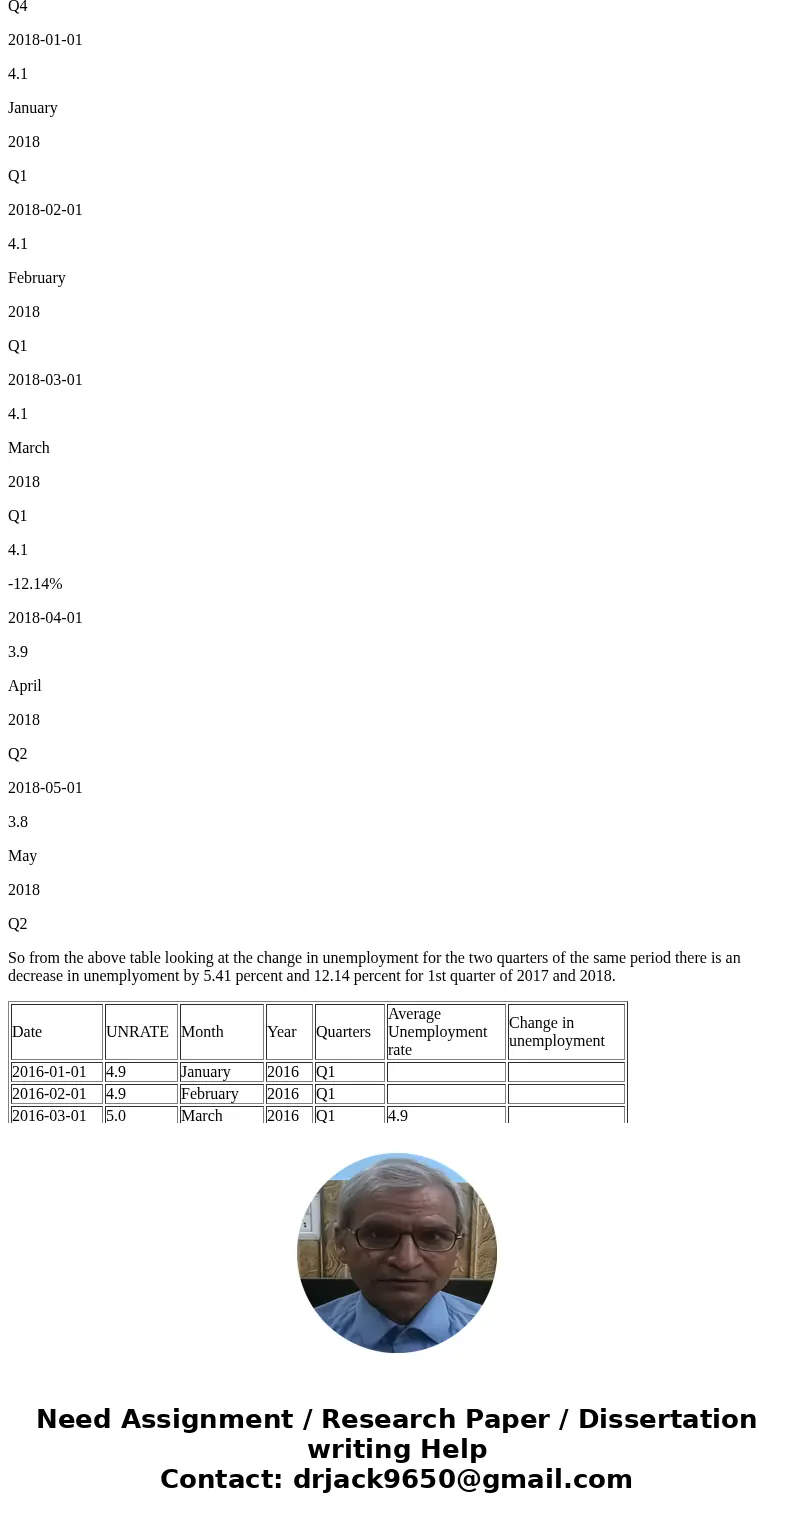
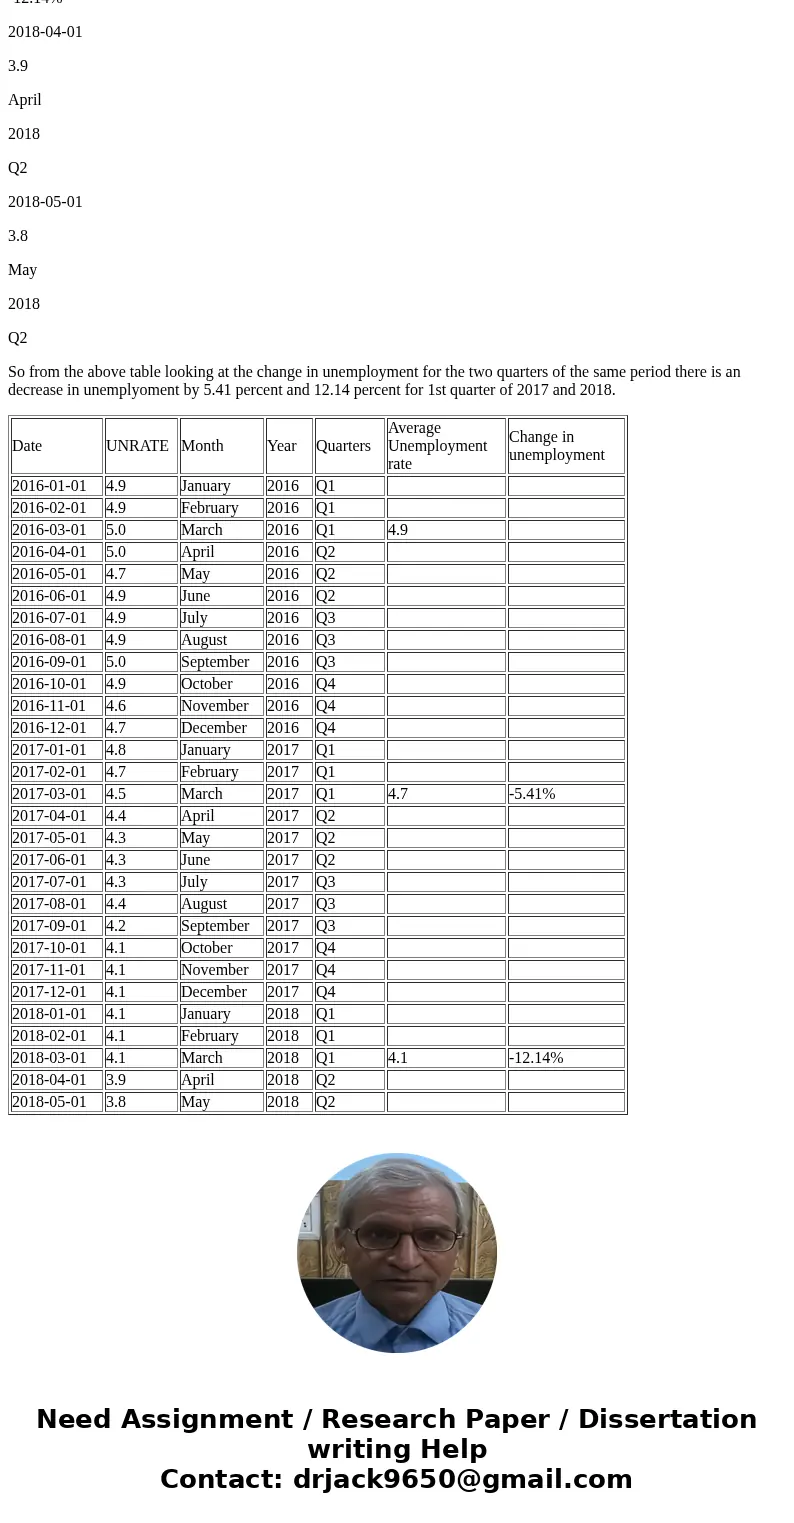
So from the above table looking at the change in unemployment for the two quarters of the same period there is an decrease in unemplyoment by 5.41 percent and 12.14 percent for 1st quarter of 2017 and 2018.
| Date | UNRATE | Month | Year | Quarters | Average Unemployment rate | Change in unemployment |
| 2016-01-01 | 4.9 | January | 2016 | Q1 | ||
| 2016-02-01 | 4.9 | February | 2016 | Q1 | ||
| 2016-03-01 | 5.0 | March | 2016 | Q1 | 4.9 | |
| 2016-04-01 | 5.0 | April | 2016 | Q2 | ||
| 2016-05-01 | 4.7 | May | 2016 | Q2 | ||
| 2016-06-01 | 4.9 | June | 2016 | Q2 | ||
| 2016-07-01 | 4.9 | July | 2016 | Q3 | ||
| 2016-08-01 | 4.9 | August | 2016 | Q3 | ||
| 2016-09-01 | 5.0 | September | 2016 | Q3 | ||
| 2016-10-01 | 4.9 | October | 2016 | Q4 | ||
| 2016-11-01 | 4.6 | November | 2016 | Q4 | ||
| 2016-12-01 | 4.7 | December | 2016 | Q4 | ||
| 2017-01-01 | 4.8 | January | 2017 | Q1 | ||
| 2017-02-01 | 4.7 | February | 2017 | Q1 | ||
| 2017-03-01 | 4.5 | March | 2017 | Q1 | 4.7 | -5.41% |
| 2017-04-01 | 4.4 | April | 2017 | Q2 | ||
| 2017-05-01 | 4.3 | May | 2017 | Q2 | ||
| 2017-06-01 | 4.3 | June | 2017 | Q2 | ||
| 2017-07-01 | 4.3 | July | 2017 | Q3 | ||
| 2017-08-01 | 4.4 | August | 2017 | Q3 | ||
| 2017-09-01 | 4.2 | September | 2017 | Q3 | ||
| 2017-10-01 | 4.1 | October | 2017 | Q4 | ||
| 2017-11-01 | 4.1 | November | 2017 | Q4 | ||
| 2017-12-01 | 4.1 | December | 2017 | Q4 | ||
| 2018-01-01 | 4.1 | January | 2018 | Q1 | ||
| 2018-02-01 | 4.1 | February | 2018 | Q1 | ||
| 2018-03-01 | 4.1 | March | 2018 | Q1 | 4.1 | -12.14% |
| 2018-04-01 | 3.9 | April | 2018 | Q2 | ||
| 2018-05-01 | 3.8 | May | 2018 | Q2 |


 Homework Sourse