The Philadelphia Phillies defeated the Tampa Bay Rays 4 to 3
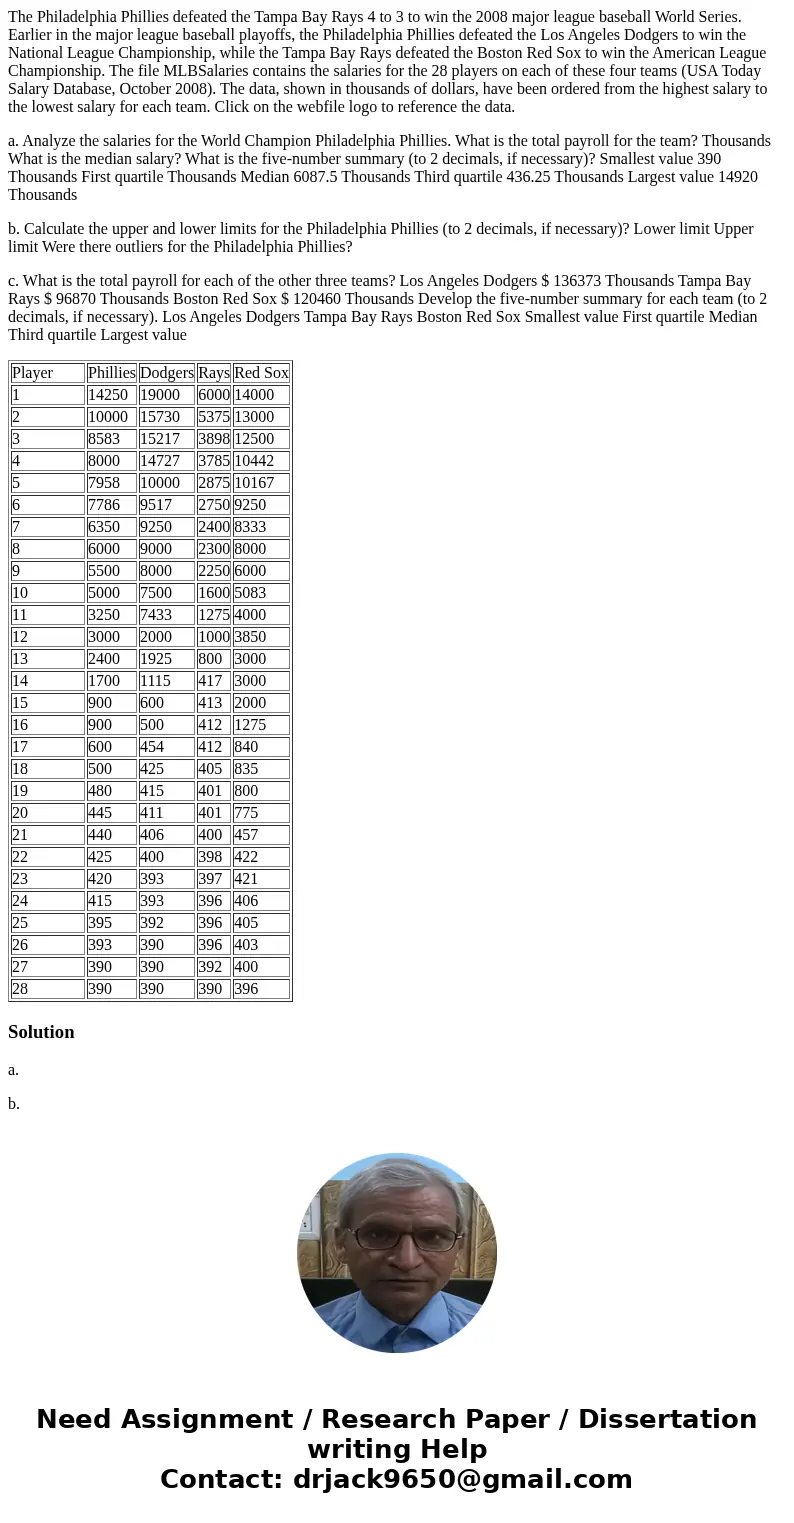
The Philadelphia Phillies defeated the Tampa Bay Rays 4 to 3 to win the 2008 major league baseball World Series. Earlier in the major league baseball playoffs, the Philadelphia Phillies defeated the Los Angeles Dodgers to win the National League Championship, while the Tampa Bay Rays defeated the Boston Red Sox to win the American League Championship. The file MLBSalaries contains the salaries for the 28 players on each of these four teams (USA Today Salary Database, October 2008). The data, shown in thousands of dollars, have been ordered from the highest salary to the lowest salary for each team. Click on the webfile logo to reference the data.
a. Analyze the salaries for the World Champion Philadelphia Phillies. What is the total payroll for the team? Thousands What is the median salary? What is the five-number summary (to 2 decimals, if necessary)? Smallest value 390 Thousands First quartile Thousands Median 6087.5 Thousands Third quartile 436.25 Thousands Largest value 14920 Thousands
b. Calculate the upper and lower limits for the Philadelphia Phillies (to 2 decimals, if necessary)? Lower limit Upper limit Were there outliers for the Philadelphia Phillies?
c. What is the total payroll for each of the other three teams? Los Angeles Dodgers $ 136373 Thousands Tampa Bay Rays $ 96870 Thousands Boston Red Sox $ 120460 Thousands Develop the five-number summary for each team (to 2 decimals, if necessary). Los Angeles Dodgers Tampa Bay Rays Boston Red Sox Smallest value First quartile Median Third quartile Largest value
| Player | Phillies | Dodgers | Rays | Red Sox |
| 1 | 14250 | 19000 | 6000 | 14000 |
| 2 | 10000 | 15730 | 5375 | 13000 |
| 3 | 8583 | 15217 | 3898 | 12500 |
| 4 | 8000 | 14727 | 3785 | 10442 |
| 5 | 7958 | 10000 | 2875 | 10167 |
| 6 | 7786 | 9517 | 2750 | 9250 |
| 7 | 6350 | 9250 | 2400 | 8333 |
| 8 | 6000 | 9000 | 2300 | 8000 |
| 9 | 5500 | 8000 | 2250 | 6000 |
| 10 | 5000 | 7500 | 1600 | 5083 |
| 11 | 3250 | 7433 | 1275 | 4000 |
| 12 | 3000 | 2000 | 1000 | 3850 |
| 13 | 2400 | 1925 | 800 | 3000 |
| 14 | 1700 | 1115 | 417 | 3000 |
| 15 | 900 | 600 | 413 | 2000 |
| 16 | 900 | 500 | 412 | 1275 |
| 17 | 600 | 454 | 412 | 840 |
| 18 | 500 | 425 | 405 | 835 |
| 19 | 480 | 415 | 401 | 800 |
| 20 | 445 | 411 | 401 | 775 |
| 21 | 440 | 406 | 400 | 457 |
| 22 | 425 | 400 | 398 | 422 |
| 23 | 420 | 393 | 397 | 421 |
| 24 | 415 | 393 | 396 | 406 |
| 25 | 395 | 392 | 396 | 405 |
| 26 | 393 | 390 | 396 | 403 |
| 27 | 390 | 390 | 392 | 400 |
| 28 | 390 | 390 | 390 | 396 |
Solution
a.
b.
Interquartile range : IQR = 3rd Quartile - 1st quartile = 6087.5 - 436.25 = 5651.25
Lower limit = Q1 - 1.5*IQR = 436.25- 1.5*5651.25 = -8040.63
Upper Limit = Q3 +1.5*IQR = 6087.5 + 1.5*5651.25 = 14564.38
c.
https://www.dropbox.com/s/br916dbdvm5qwoh/Phillies.xlsx?dl=0
| Phillies | |
| Total Payroll | 96870 |
| Smallest | 390 |
| First Quartile | 436.25 |
| Median | 1300 |
| Third Quartile | 6087.5 |
| Largest | 14250 |


 Homework Sourse