Table Selected information of Ouyang Inc In 2013 the actual
Table: Selected information of Ouyang Inc.
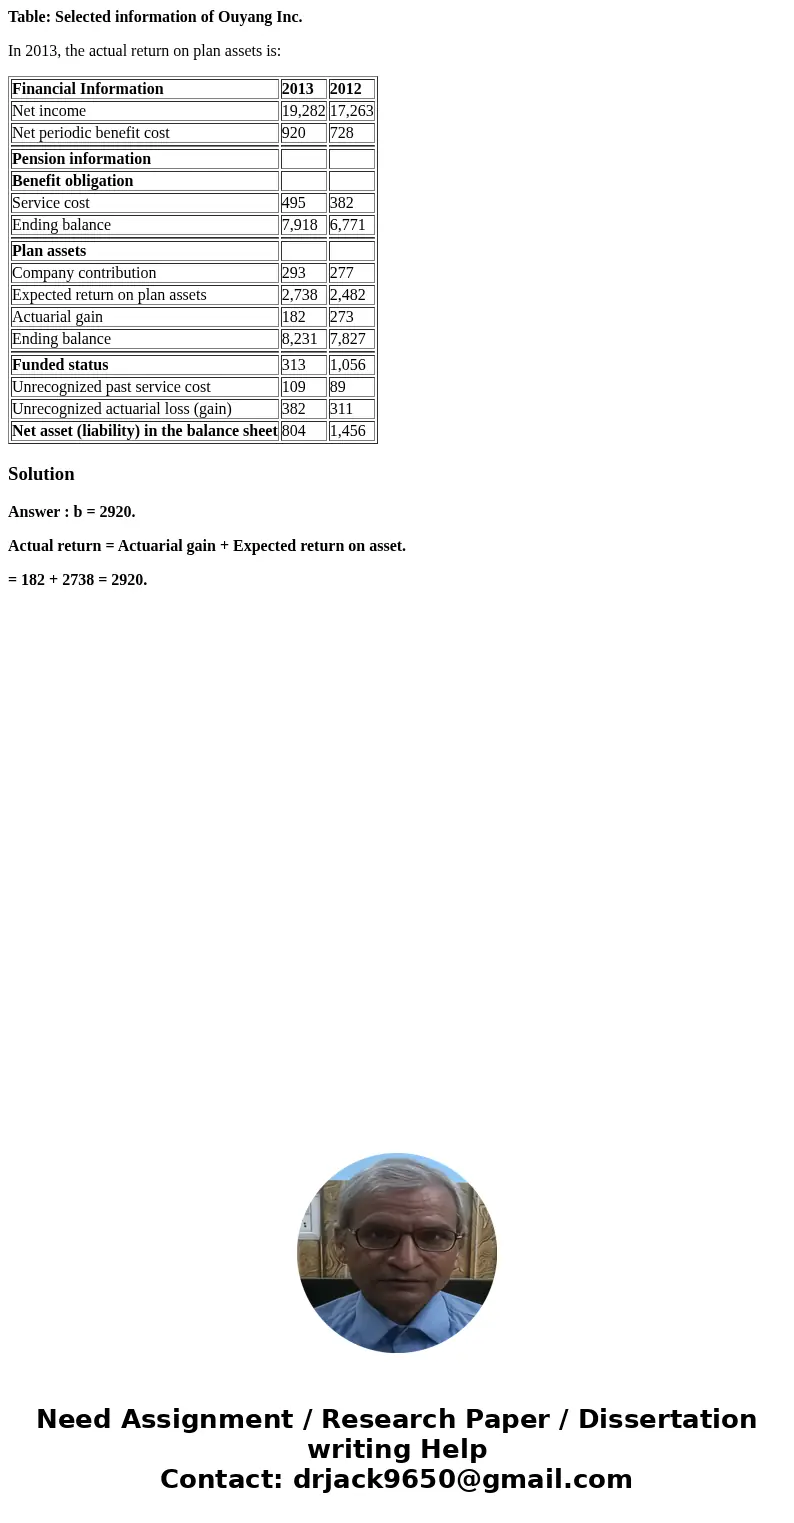
In 2013, the actual return on plan assets is:
| Financial Information | 2013 | 2012 |
| Net income | 19,282 | 17,263 |
| Net periodic benefit cost | 920 | 728 |
| Pension information | ||
| Benefit obligation | ||
| Service cost | 495 | 382 |
| Ending balance | 7,918 | 6,771 |
| Plan assets | ||
| Company contribution | 293 | 277 |
| Expected return on plan assets | 2,738 | 2,482 |
| Actuarial gain | 182 | 273 |
| Ending balance | 8,231 | 7,827 |
| Funded status | 313 | 1,056 |
| Unrecognized past service cost | 109 | 89 |
| Unrecognized actuarial loss (gain) | 382 | 311 |
| Net asset (liability) in the balance sheet | 804 | 1,456 |
Solution
Answer : b = 2920.
Actual return = Actuarial gain + Expected return on asset.
= 182 + 2738 = 2920.

 Homework Sourse