Im searching for help filling out this chart I dont understa
I\'m searching for help filling out this chart. I don\'t understand the calculations required.
please help! Thank you
My standard curve from my bradford assay is
y=0.0094x+0.0379
y=abs at 595
x=protein amount
Solution
1.
Total Protein = Protein*Volume
Total Activity = Activity*Volume
Specific Activity = Total Activity/Total Protein
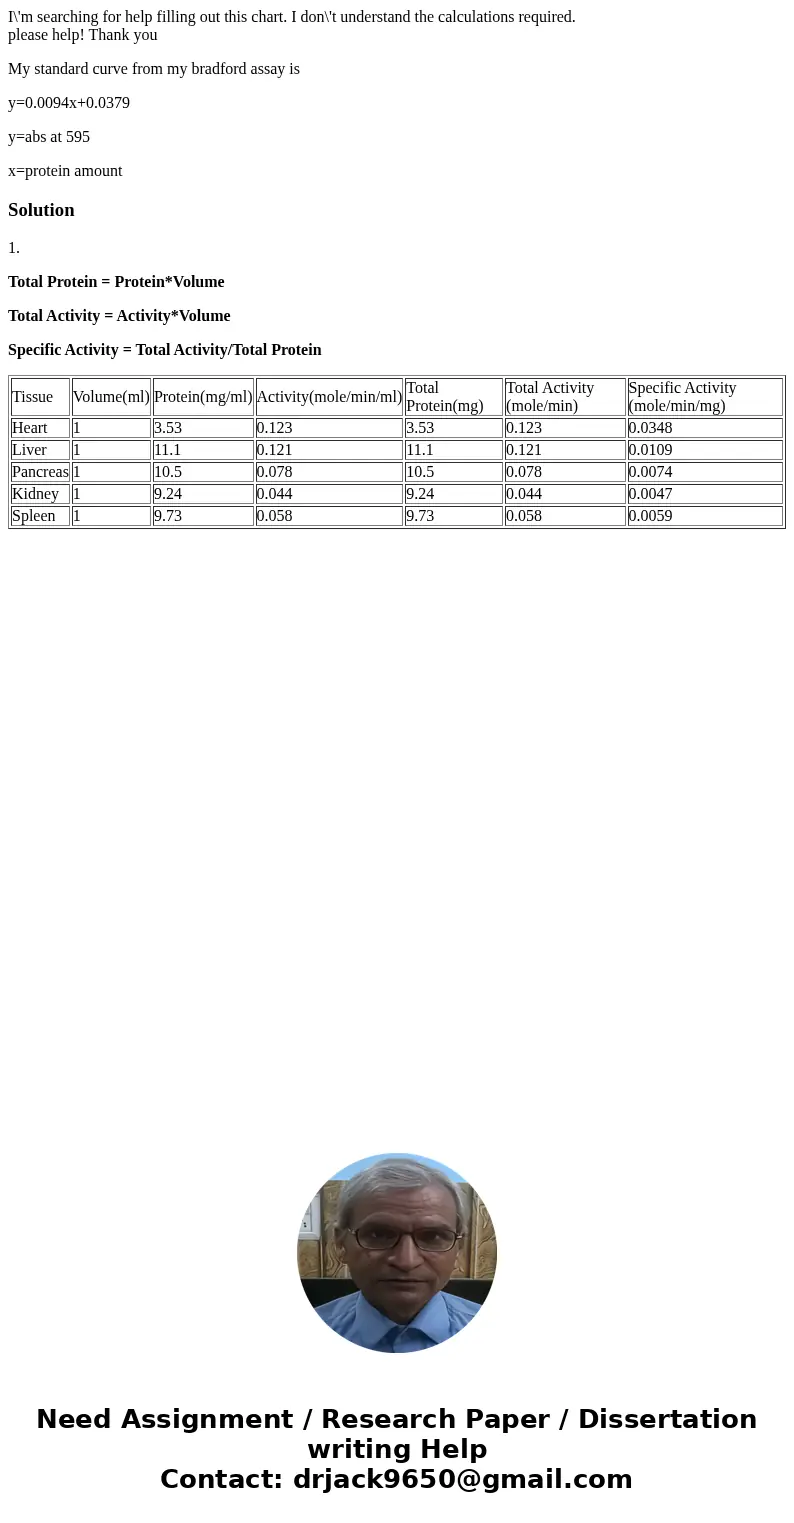
| Tissue | Volume(ml) | Protein(mg/ml) | Activity(mole/min/ml) | Total Protein(mg) | Total Activity (mole/min) | Specific Activity (mole/min/mg) |
| Heart | 1 | 3.53 | 0.123 | 3.53 | 0.123 | 0.0348 |
| Liver | 1 | 11.1 | 0.121 | 11.1 | 0.121 | 0.0109 |
| Pancreas | 1 | 10.5 | 0.078 | 10.5 | 0.078 | 0.0074 |
| Kidney | 1 | 9.24 | 0.044 | 9.24 | 0.044 | 0.0047 |
| Spleen | 1 | 9.73 | 0.058 | 9.73 | 0.058 | 0.0059 |

 Homework Sourse