Thornton Companys Income statement information follows Net s
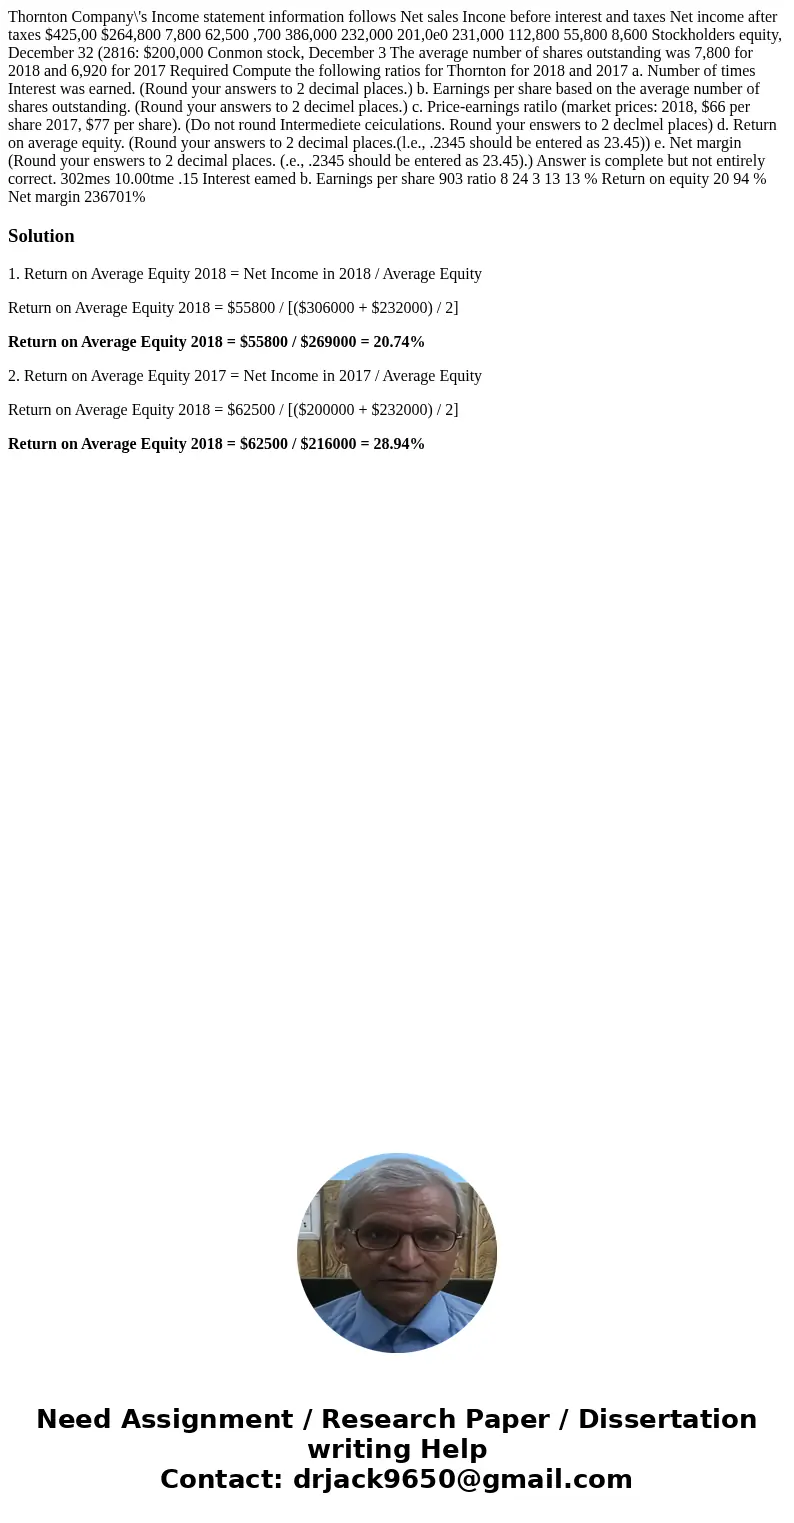
Thornton Company\'s Income statement information follows Net sales Incone before interest and taxes Net income after taxes $425,00 $264,800 7,800 62,500 ,700 386,000 232,000 201,0e0 231,000 112,800 55,800 8,600 Stockholders equity, December 32 (2816: $200,000 Conmon stock, December 3 The average number of shares outstanding was 7,800 for 2018 and 6,920 for 2017 Required Compute the following ratios for Thornton for 2018 and 2017 a. Number of times Interest was earned. (Round your answers to 2 decimal places.) b. Earnings per share based on the average number of shares outstanding. (Round your answers to 2 decimel places.) c. Price-earnings ratilo (market prices: 2018, $66 per share 2017, $77 per share). (Do not round Intermediete ceiculations. Round your enswers to 2 declmel places) d. Return on average equity. (Round your answers to 2 decimal places.(l.e., .2345 should be entered as 23.45)) e. Net margin (Round your enswers to 2 decimal places. (.e., .2345 should be entered as 23.45).) Answer is complete but not entirely correct. 302mes 10.00tme .15 Interest eamed b. Earnings per share 903 ratio 8 24 3 13 13 % Return on equity 20 94 % Net margin 236701% 
Solution
1. Return on Average Equity 2018 = Net Income in 2018 / Average Equity
Return on Average Equity 2018 = $55800 / [($306000 + $232000) / 2]
Return on Average Equity 2018 = $55800 / $269000 = 20.74%
2. Return on Average Equity 2017 = Net Income in 2017 / Average Equity
Return on Average Equity 2018 = $62500 / [($200000 + $232000) / 2]
Return on Average Equity 2018 = $62500 / $216000 = 28.94%

 Homework Sourse