A worker is reviewing his pay increases over the past severa
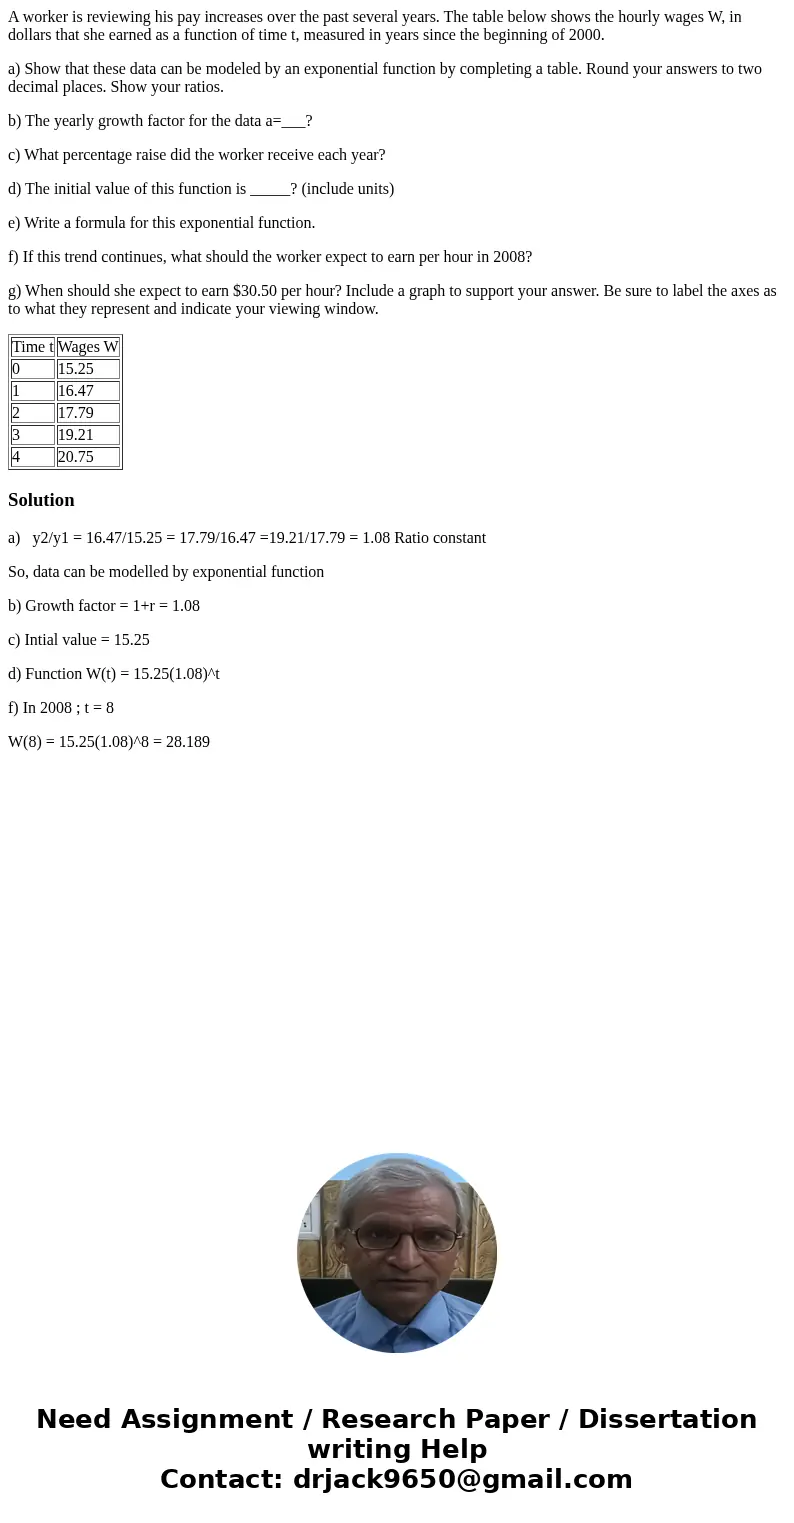
A worker is reviewing his pay increases over the past several years. The table below shows the hourly wages W, in dollars that she earned as a function of time t, measured in years since the beginning of 2000.
a) Show that these data can be modeled by an exponential function by completing a table. Round your answers to two decimal places. Show your ratios.
b) The yearly growth factor for the data a=___?
c) What percentage raise did the worker receive each year?
d) The initial value of this function is _____? (include units)
e) Write a formula for this exponential function.
f) If this trend continues, what should the worker expect to earn per hour in 2008?
g) When should she expect to earn $30.50 per hour? Include a graph to support your answer. Be sure to label the axes as to what they represent and indicate your viewing window.
| Time t | Wages W |
| 0 | 15.25 |
| 1 | 16.47 |
| 2 | 17.79 |
| 3 | 19.21 |
| 4 | 20.75 |
Solution
a) y2/y1 = 16.47/15.25 = 17.79/16.47 =19.21/17.79 = 1.08 Ratio constant
So, data can be modelled by exponential function
b) Growth factor = 1+r = 1.08
c) Intial value = 15.25
d) Function W(t) = 15.25(1.08)^t
f) In 2008 ; t = 8
W(8) = 15.25(1.08)^8 = 28.189

 Homework Sourse