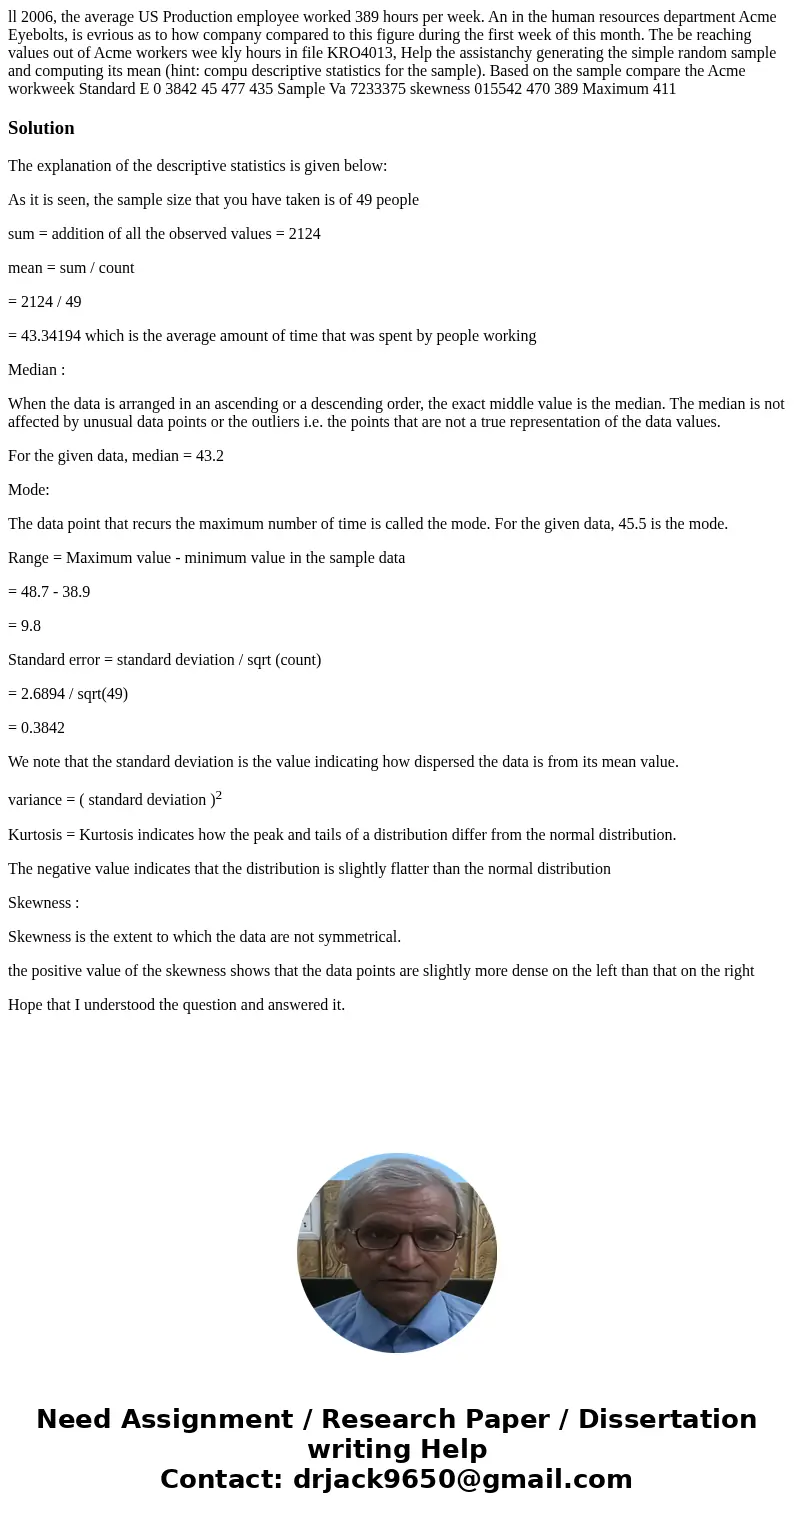
ll 2006 the average US Production employee worked 389 hours
Solution
The explanation of the descriptive statistics is given below:
As it is seen, the sample size that you have taken is of 49 people
sum = addition of all the observed values = 2124
mean = sum / count
= 2124 / 49
= 43.34194 which is the average amount of time that was spent by people working
Median :
When the data is arranged in an ascending or a descending order, the exact middle value is the median. The median is not affected by unusual data points or the outliers i.e. the points that are not a true representation of the data values.
For the given data, median = 43.2
Mode:
The data point that recurs the maximum number of time is called the mode. For the given data, 45.5 is the mode.
Range = Maximum value - minimum value in the sample data
= 48.7 - 38.9
= 9.8
Standard error = standard deviation / sqrt (count)
= 2.6894 / sqrt(49)
= 0.3842
We note that the standard deviation is the value indicating how dispersed the data is from its mean value.
variance = ( standard deviation )2
Kurtosis = Kurtosis indicates how the peak and tails of a distribution differ from the normal distribution.
The negative value indicates that the distribution is slightly flatter than the normal distribution
Skewness :
Skewness is the extent to which the data are not symmetrical.
the positive value of the skewness shows that the data points are slightly more dense on the left than that on the right
Hope that I understood the question and answered it.

 Homework Sourse