Q Florida Power and Light has committed to building a solar
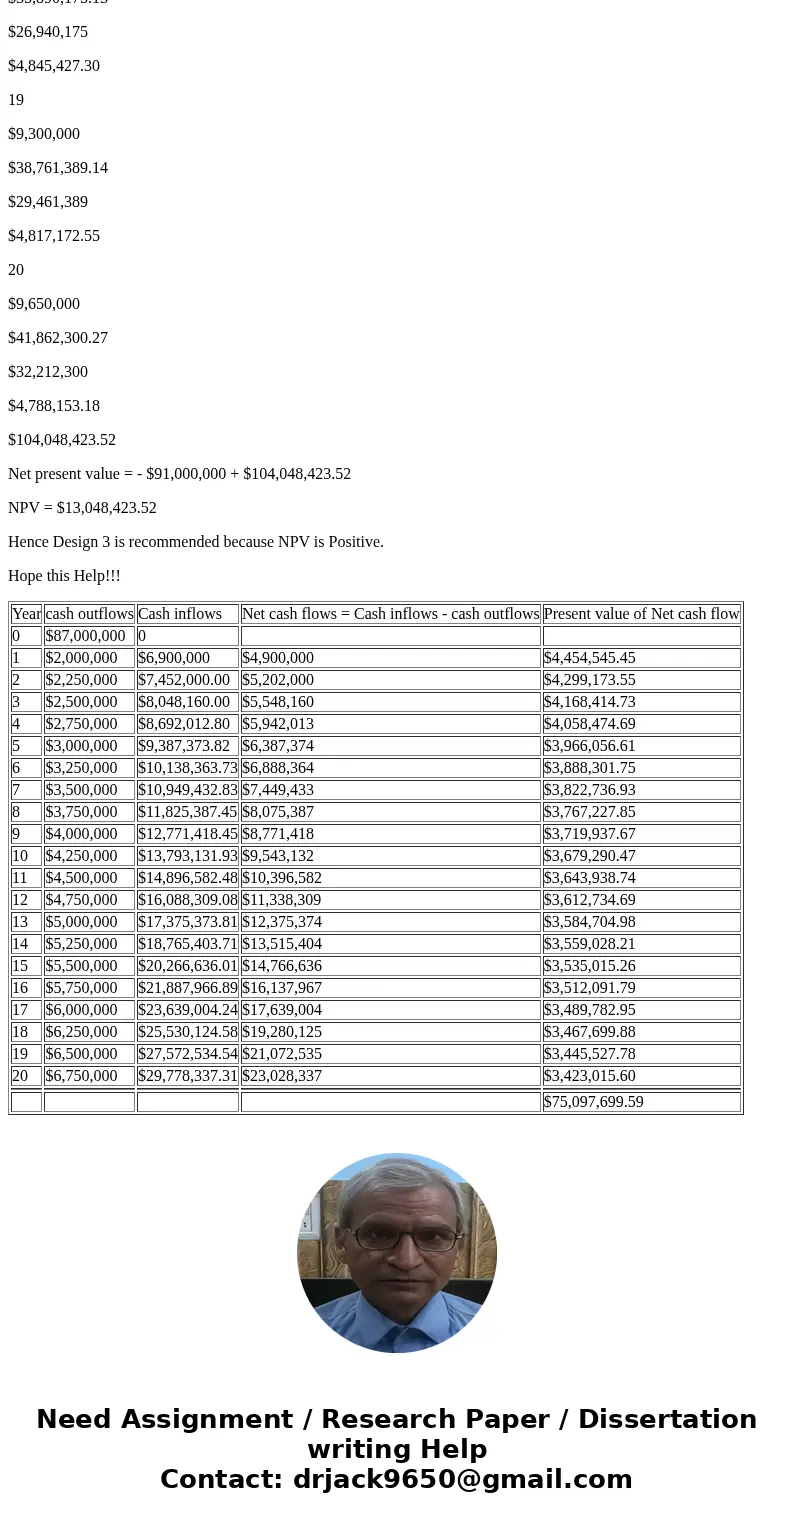
Q) Florida Power and Light has committed to building a solar power plant. JoAnne, an IE working for FPL, has been tasked with evaluating the three current designs. FPL uses an interest rate of 10% and a 20-year horizon.
Design 1: Flat Solar Panels A field of \"flat\" solar panels angled to best catch the sun will yield 2.6 MW of power and will cost $87 million initially with first-year operating costs at $2 million, growing $250,000 annually. It will produce electricity worth $6.9 million the first year and will increase by 8% each year thereafter.
Design 2: Mechanized Solar Panels A field of mechanized solar panels rotates from side to side so that they are always positioned parallel to the sun\'s rays, maximizing the production of elec-tricity. This design will yield 3.1 MW of power and will cost $101 million initially with first-year operat-ing costs at $2.3 million, growing $300,000 annually. It will produce electricity worth $8.8 million the first year and will increase 8% each year thereafter.
Design 3: Solar Collector Field This design uses a field of mirrors to focus the sun\'s rays onto a boiler mounted in a tower. The boiler then produces steam and generates electricity the same way a coal-fired plant operates. This system will yield 3.3 MW of power and will cost $91 million initially with first-year operating costs at $3 million, growing $350,000 annually. It will produce electric-ity worth $9.7 million the first year and will increase 8% each year thereafter.
Which design is better?
Solution
To find the best design , we will calculate the Net Present Value!!.
Design 1: Flat Solar Panels
Year
cash outflows
Cash inflows
Net cash flows = Cash inflows - cash outflows
Present value of Net cash flow
0
$87,000,000
0
1
$2,000,000
$6,900,000
$4,900,000
$4,454,545.45
2
$2,250,000
$7,452,000.00
$5,202,000
$4,299,173.55
3
$2,500,000
$8,048,160.00
$5,548,160
$4,168,414.73
4
$2,750,000
$8,692,012.80
$5,942,013
$4,058,474.69
5
$3,000,000
$9,387,373.82
$6,387,374
$3,966,056.61
6
$3,250,000
$10,138,363.73
$6,888,364
$3,888,301.75
7
$3,500,000
$10,949,432.83
$7,449,433
$3,822,736.93
8
$3,750,000
$11,825,387.45
$8,075,387
$3,767,227.85
9
$4,000,000
$12,771,418.45
$8,771,418
$3,719,937.67
10
$4,250,000
$13,793,131.93
$9,543,132
$3,679,290.47
11
$4,500,000
$14,896,582.48
$10,396,582
$3,643,938.74
12
$4,750,000
$16,088,309.08
$11,338,309
$3,612,734.69
13
$5,000,000
$17,375,373.81
$12,375,374
$3,584,704.98
14
$5,250,000
$18,765,403.71
$13,515,404
$3,559,028.21
15
$5,500,000
$20,266,636.01
$14,766,636
$3,535,015.26
16
$5,750,000
$21,887,966.89
$16,137,967
$3,512,091.79
17
$6,000,000
$23,639,004.24
$17,639,004
$3,489,782.95
18
$6,250,000
$25,530,124.58
$19,280,125
$3,467,699.88
19
$6,500,000
$27,572,534.54
$21,072,535
$3,445,527.78
20
$6,750,000
$29,778,337.31
$23,028,337
$3,423,015.60
$75,097,699.59
Net present value = - $ 87,000,000 + $75,097,699.59
Net present value = - $11,902,300.41
Design 2: Mechanized Solar Panels
Year
cash outflows
Cash inflows
Net cash flows = Cash inflows - cash outflows
Present value of Net cash flow
0
$101,000,000
1
$2,300,000
$8,800,000
$6,500,000
$5,909,090.91
2
$2,600,000
$9,504,000.00
$6,904,000
$5,705,785.12
3
$2,900,000
$10,264,320.00
$7,364,320
$5,532,922.61
4
$3,200,000
$11,085,465.60
$7,885,466
$5,385,879.11
5
$3,500,000
$11,972,302.85
$8,472,303
$5,260,633.49
6
$3,800,000
$12,930,087.08
$9,130,087
$5,153,696.13
7
$4,100,000
$13,964,494.04
$9,864,494
$5,062,045.20
8
$4,400,000
$15,081,653.57
$10,681,654
$4,983,070.22
9
$4,700,000
$16,288,185.85
$11,588,186
$4,914,522.02
10
$5,000,000
$17,591,240.72
$12,591,241
$4,854,468.36
11
$5,300,000
$18,998,539.98
$13,698,540
$4,801,254.69
12
$5,600,000
$20,518,423.17
$14,918,423
$4,753,469.37
13
$5,900,000
$22,159,897.03
$16,259,897
$4,709,912.99
14
$6,200,000
$23,932,688.79
$17,732,689
$4,669,571.18
15
$6,500,000
$25,847,303.89
$19,347,304
$4,631,590.73
16
$6,800,000
$27,915,088.20
$21,115,088
$4,595,258.40
17
$7,100,000
$30,148,295.26
$23,048,295
$4,559,982.34
18
$7,400,000
$32,560,158.88
$25,160,159
$4,525,275.73
19
$7,700,000
$35,164,971.59
$27,464,972
$4,490,742.32
20
$8,000,000
$37,978,169.32
$29,978,169
$4,456,063.85
$98,955,234.80
Net present value = - $101,000,000 + $98,955,234.80
NPV = - $2,044,765.20
Design 3: Solar Collector Field
Year
cash outflows
Cash inflows
Net cash flows = Cash inflows - cash outflows
Present value of Net cash flow
0
$91,000,000
1
$3,000,000
$9,700,000
$6,700,000
$6,090,909.09
2
$3,350,000
$10,476,000.00
$7,126,000
$5,889,256.20
3
$3,700,000
$11,314,080.00
$7,614,080
$5,720,571.00
4
$4,050,000
$12,219,206.40
$8,169,206
$5,579,677.89
5
$4,400,000
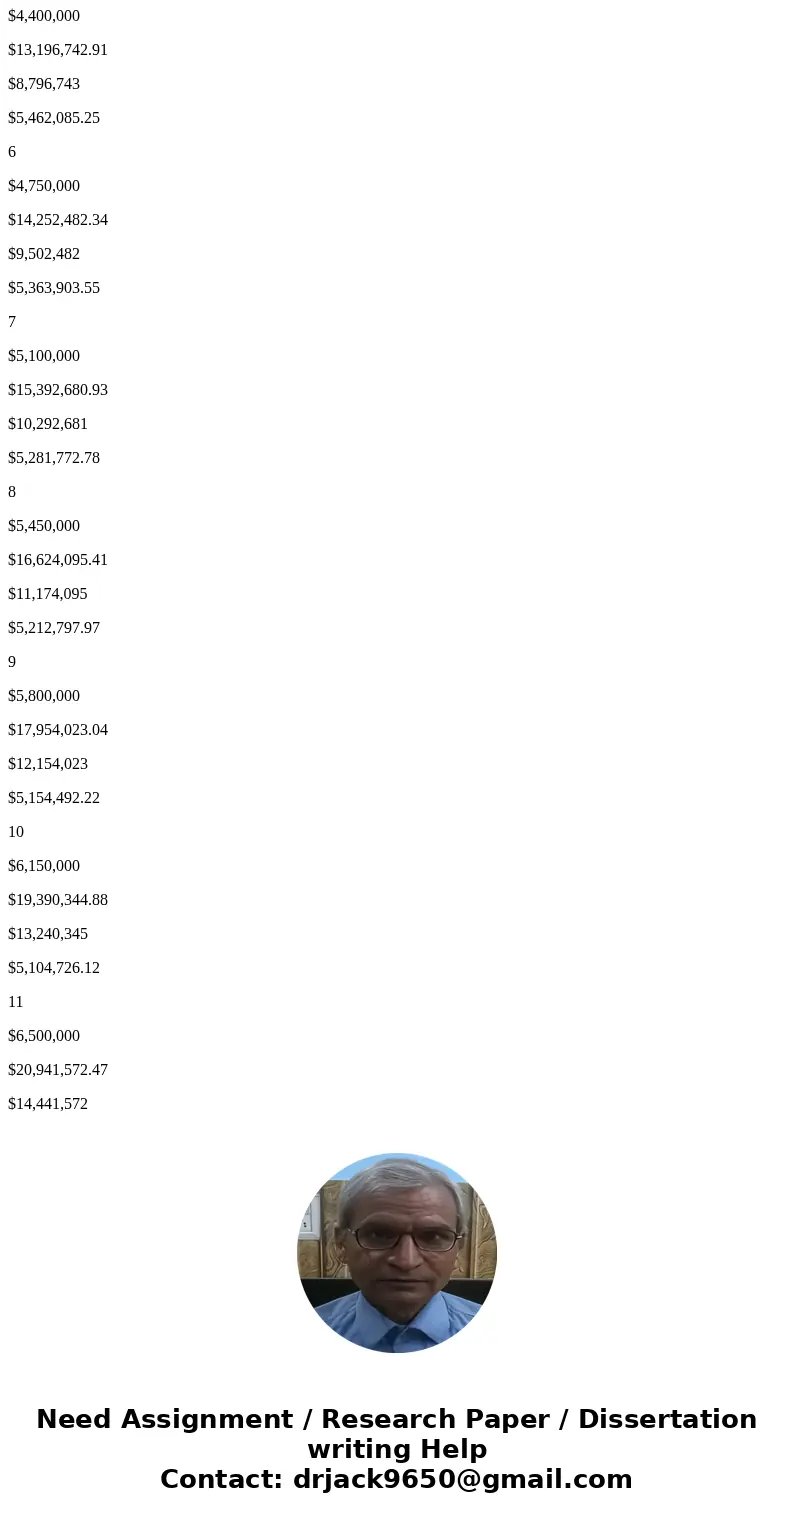
$13,196,742.91
$8,796,743
$5,462,085.25
6
$4,750,000
$14,252,482.34
$9,502,482
$5,363,903.55
7
$5,100,000
$15,392,680.93
$10,292,681
$5,281,772.78
8
$5,450,000
$16,624,095.41
$11,174,095
$5,212,797.97
9
$5,800,000
$17,954,023.04
$12,154,023
$5,154,492.22
10
$6,150,000
$19,390,344.88
$13,240,345
$5,104,726.12
11
$6,500,000
$20,941,572.47
$14,441,572
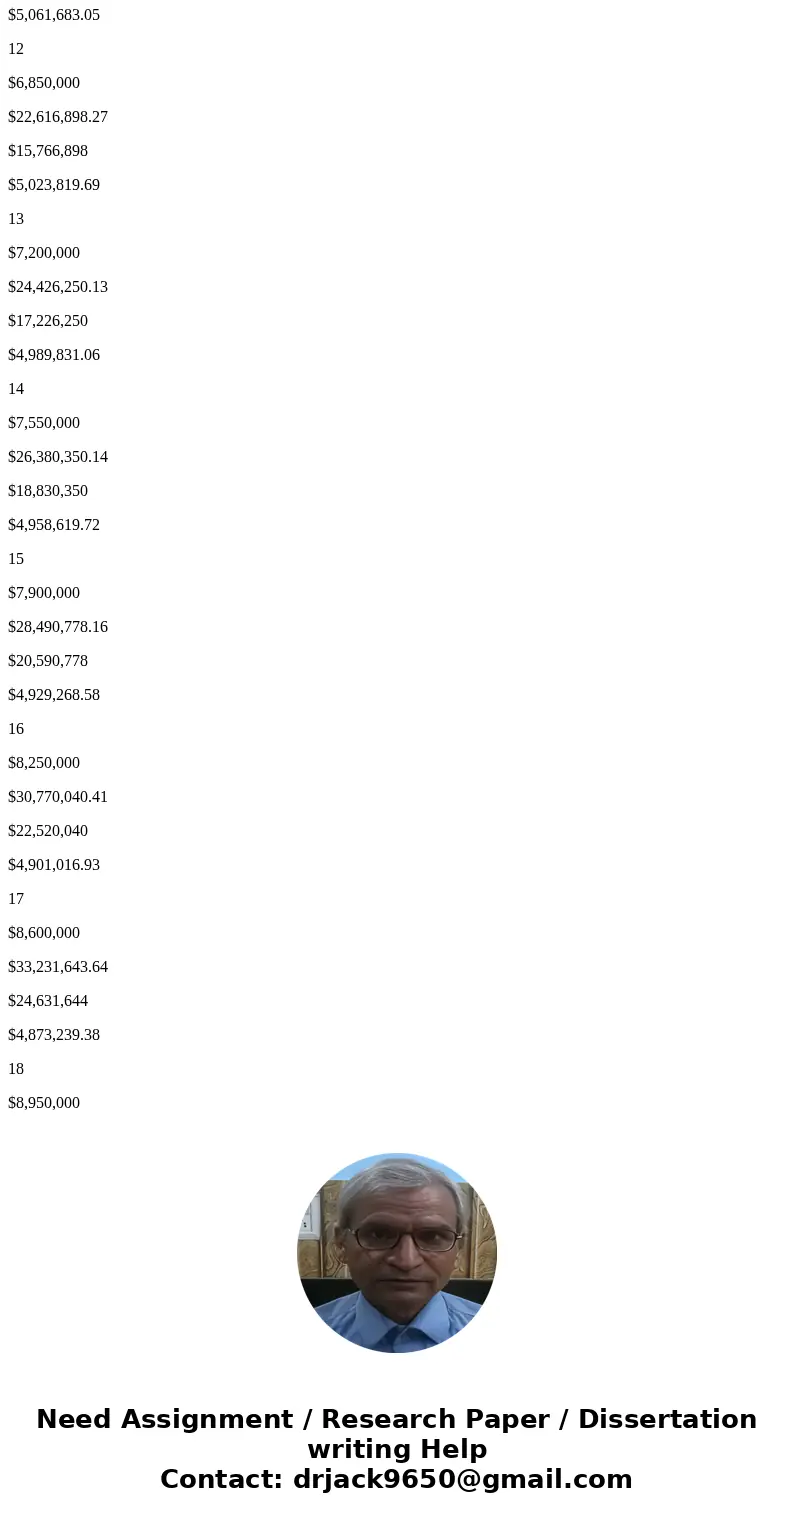
$5,061,683.05
12
$6,850,000
$22,616,898.27
$15,766,898
$5,023,819.69
13
$7,200,000
$24,426,250.13
$17,226,250
$4,989,831.06
14
$7,550,000
$26,380,350.14
$18,830,350
$4,958,619.72
15
$7,900,000
$28,490,778.16
$20,590,778
$4,929,268.58
16
$8,250,000
$30,770,040.41
$22,520,040
$4,901,016.93
17
$8,600,000
$33,231,643.64
$24,631,644
$4,873,239.38
18
$8,950,000
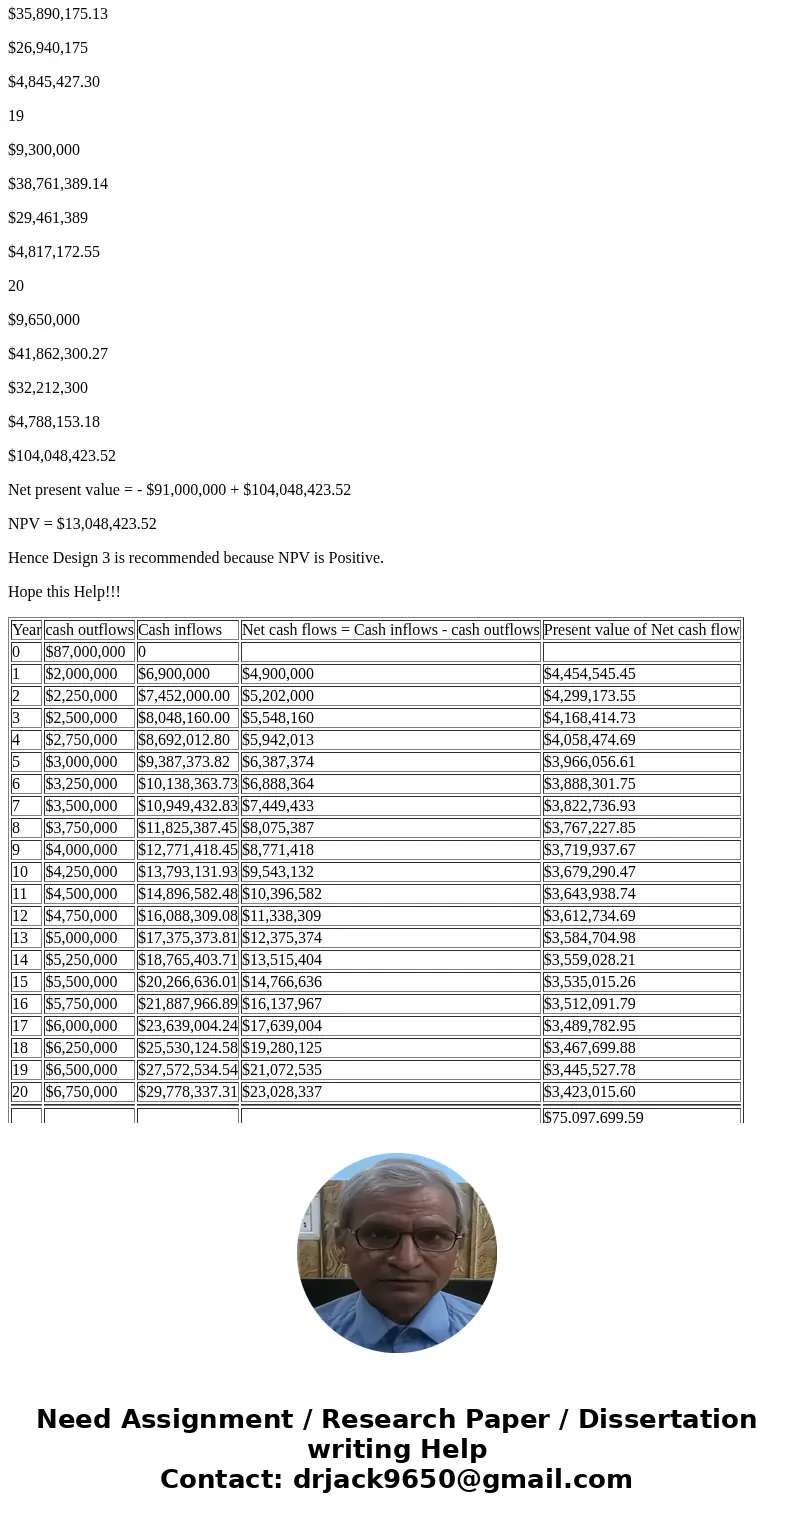
$35,890,175.13
$26,940,175
$4,845,427.30
19
$9,300,000
$38,761,389.14
$29,461,389
$4,817,172.55
20
$9,650,000
$41,862,300.27
$32,212,300
$4,788,153.18
$104,048,423.52
Net present value = - $91,000,000 + $104,048,423.52
NPV = $13,048,423.52
Hence Design 3 is recommended because NPV is Positive.
Hope this Help!!!
| Year | cash outflows | Cash inflows | Net cash flows = Cash inflows - cash outflows | Present value of Net cash flow |
| 0 | $87,000,000 | 0 | ||
| 1 | $2,000,000 | $6,900,000 | $4,900,000 | $4,454,545.45 |
| 2 | $2,250,000 | $7,452,000.00 | $5,202,000 | $4,299,173.55 |
| 3 | $2,500,000 | $8,048,160.00 | $5,548,160 | $4,168,414.73 |
| 4 | $2,750,000 | $8,692,012.80 | $5,942,013 | $4,058,474.69 |
| 5 | $3,000,000 | $9,387,373.82 | $6,387,374 | $3,966,056.61 |
| 6 | $3,250,000 | $10,138,363.73 | $6,888,364 | $3,888,301.75 |
| 7 | $3,500,000 | $10,949,432.83 | $7,449,433 | $3,822,736.93 |
| 8 | $3,750,000 | $11,825,387.45 | $8,075,387 | $3,767,227.85 |
| 9 | $4,000,000 | $12,771,418.45 | $8,771,418 | $3,719,937.67 |
| 10 | $4,250,000 | $13,793,131.93 | $9,543,132 | $3,679,290.47 |
| 11 | $4,500,000 | $14,896,582.48 | $10,396,582 | $3,643,938.74 |
| 12 | $4,750,000 | $16,088,309.08 | $11,338,309 | $3,612,734.69 |
| 13 | $5,000,000 | $17,375,373.81 | $12,375,374 | $3,584,704.98 |
| 14 | $5,250,000 | $18,765,403.71 | $13,515,404 | $3,559,028.21 |
| 15 | $5,500,000 | $20,266,636.01 | $14,766,636 | $3,535,015.26 |
| 16 | $5,750,000 | $21,887,966.89 | $16,137,967 | $3,512,091.79 |
| 17 | $6,000,000 | $23,639,004.24 | $17,639,004 | $3,489,782.95 |
| 18 | $6,250,000 | $25,530,124.58 | $19,280,125 | $3,467,699.88 |
| 19 | $6,500,000 | $27,572,534.54 | $21,072,535 | $3,445,527.78 |
| 20 | $6,750,000 | $29,778,337.31 | $23,028,337 | $3,423,015.60 |
| $75,097,699.59 |
 Homework Sourse