The graphs above are for the apple market These are supply a
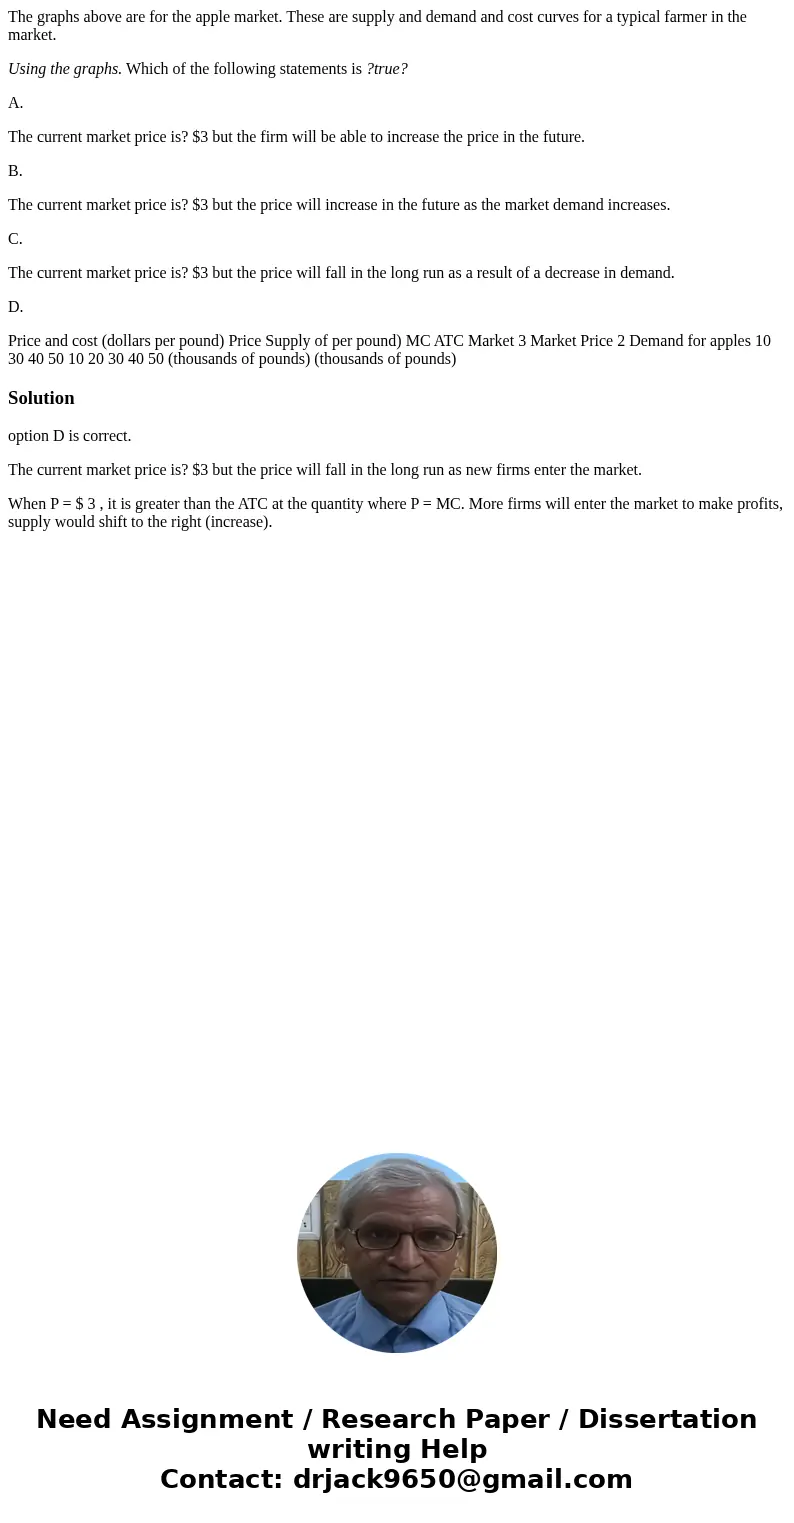
The graphs above are for the apple market. These are supply and demand and cost curves for a typical farmer in the market.
Using the graphs. Which of the following statements is ?true?
A.
The current market price is? $3 but the firm will be able to increase the price in the future.
B.
The current market price is? $3 but the price will increase in the future as the market demand increases.
C.
The current market price is? $3 but the price will fall in the long run as a result of a decrease in demand.
D.
Price and cost (dollars per pound) Price Supply of per pound) MC ATC Market 3 Market Price 2 Demand for apples 10 30 40 50 10 20 30 40 50 (thousands of pounds) (thousands of pounds)Solution
option D is correct.
The current market price is? $3 but the price will fall in the long run as new firms enter the market.
When P = $ 3 , it is greater than the ATC at the quantity where P = MC. More firms will enter the market to make profits, supply would shift to the right (increase).

 Homework Sourse