Perform a horizontal analysis for the entry Gross Margin sho
Perform a horizontal analysis for the entry \'Gross Margin\' shown on the income statement portion below. (Round to nearest tenth.)
Use parentheses to indicate a decrease.
Solution
Performa horizontal analysis :
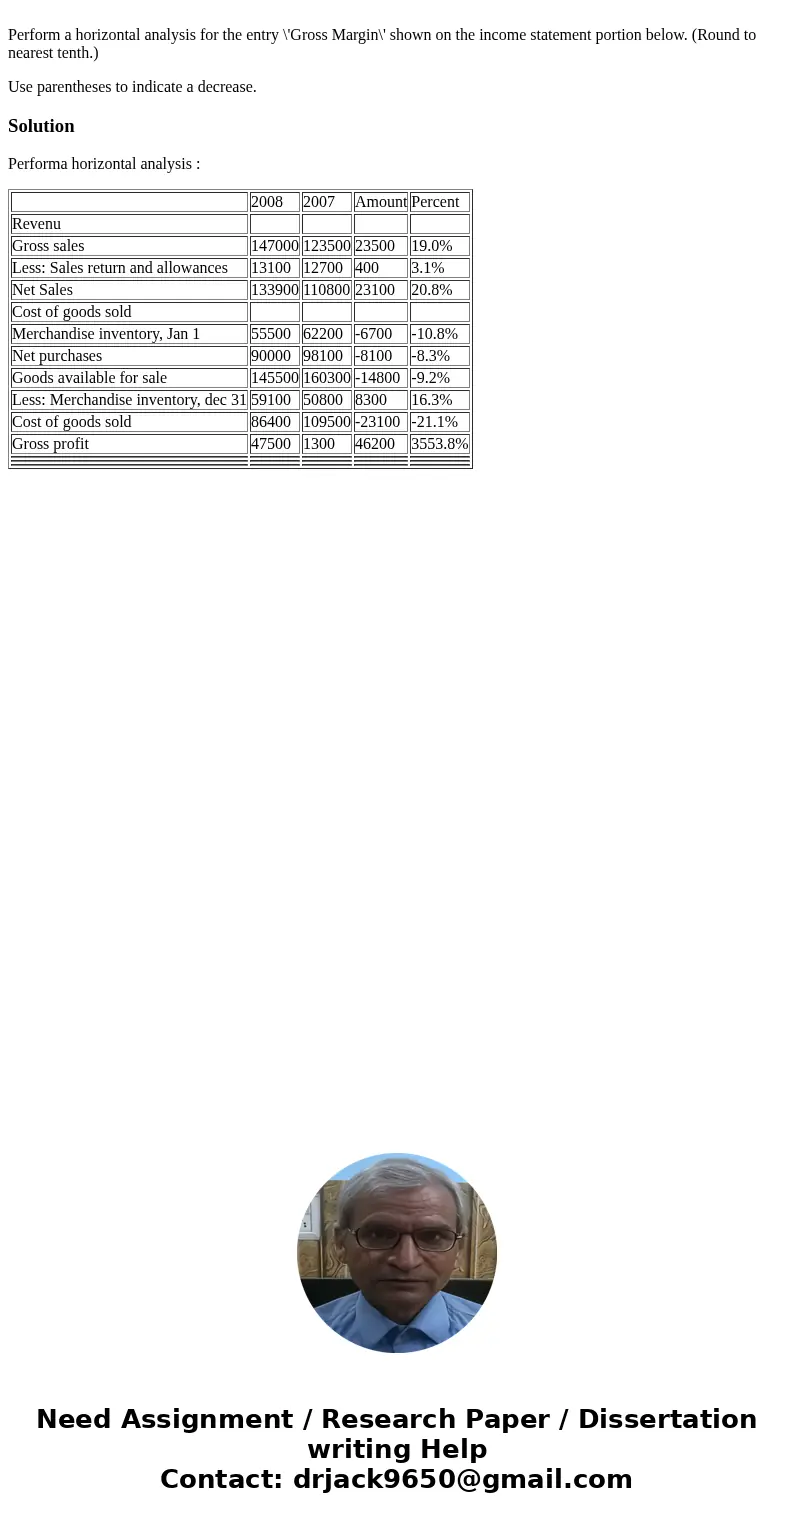
| 2008 | 2007 | Amount | Percent | |
| Revenu | ||||
| Gross sales | 147000 | 123500 | 23500 | 19.0% |
| Less: Sales return and allowances | 13100 | 12700 | 400 | 3.1% |
| Net Sales | 133900 | 110800 | 23100 | 20.8% |
| Cost of goods sold | ||||
| Merchandise inventory, Jan 1 | 55500 | 62200 | -6700 | -10.8% |
| Net purchases | 90000 | 98100 | -8100 | -8.3% |
| Goods available for sale | 145500 | 160300 | -14800 | -9.2% |
| Less: Merchandise inventory, dec 31 | 59100 | 50800 | 8300 | 16.3% |
| Cost of goods sold | 86400 | 109500 | -23100 | -21.1% |
| Gross profit | 47500 | 1300 | 46200 | 3553.8% |

 Homework Sourse