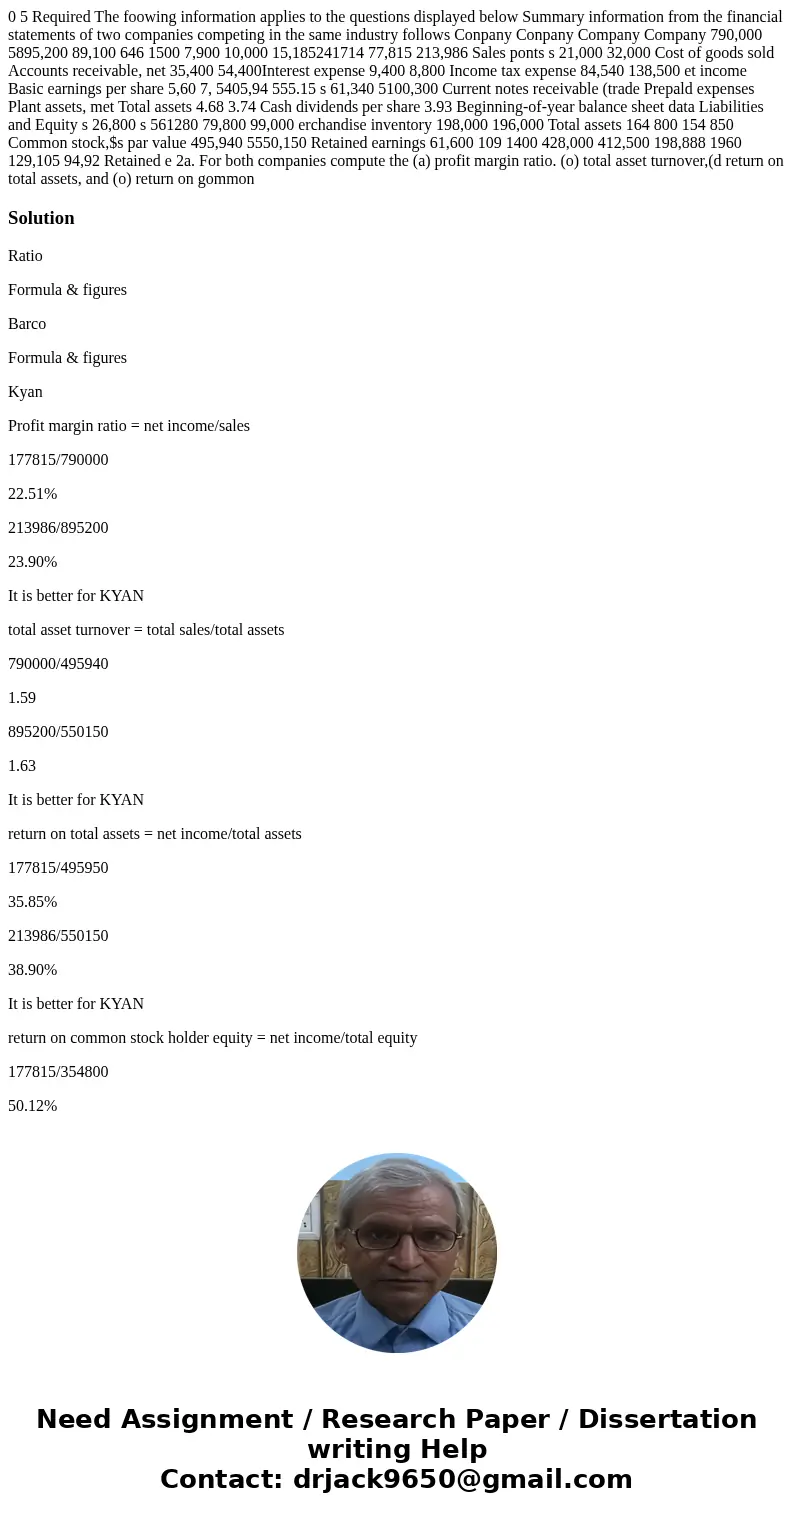
0 5 Required The foowing information applies to the question
Solution
Ratio
Formula & figures
Barco
Formula & figures
Kyan
Profit margin ratio = net income/sales
177815/790000
22.51%
213986/895200
23.90%
It is better for KYAN
total asset turnover = total sales/total assets
790000/495940
1.59
895200/550150
1.63
It is better for KYAN
return on total assets = net income/total assets
177815/495950
35.85%
213986/550150
38.90%
It is better for KYAN
return on common stock holder equity = net income/total equity
177815/354800
50.12%
213986/350850
60.99%
It is better for KYAN
price earning ratio = market price/eps
90/4.68
19.23
90/5.46
16.48
it is better for Barco
Dividend Yield = dividend paid/market price
3.74/75
4.99%
3.93/75
5.24%
it is better for kyan
On the basis of the above ratios we can say that KYAN is a better option for investment
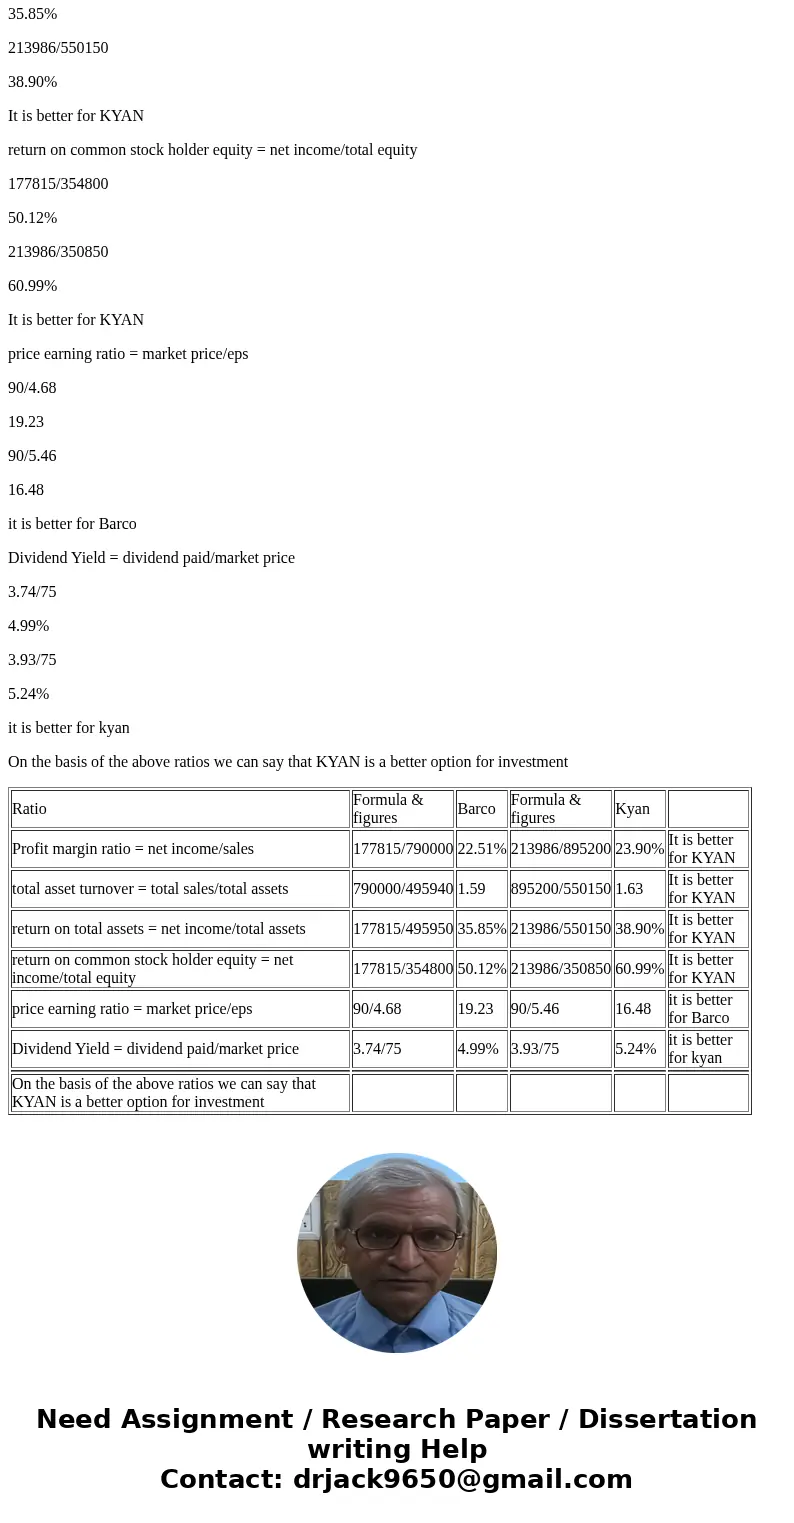
| Ratio | Formula & figures | Barco | Formula & figures | Kyan | |
| Profit margin ratio = net income/sales | 177815/790000 | 22.51% | 213986/895200 | 23.90% | It is better for KYAN |
| total asset turnover = total sales/total assets | 790000/495940 | 1.59 | 895200/550150 | 1.63 | It is better for KYAN |
| return on total assets = net income/total assets | 177815/495950 | 35.85% | 213986/550150 | 38.90% | It is better for KYAN |
| return on common stock holder equity = net income/total equity | 177815/354800 | 50.12% | 213986/350850 | 60.99% | It is better for KYAN |
| price earning ratio = market price/eps | 90/4.68 | 19.23 | 90/5.46 | 16.48 | it is better for Barco |
| Dividend Yield = dividend paid/market price | 3.74/75 | 4.99% | 3.93/75 | 5.24% | it is better for kyan |
| On the basis of the above ratios we can say that KYAN is a better option for investment |


 Homework Sourse