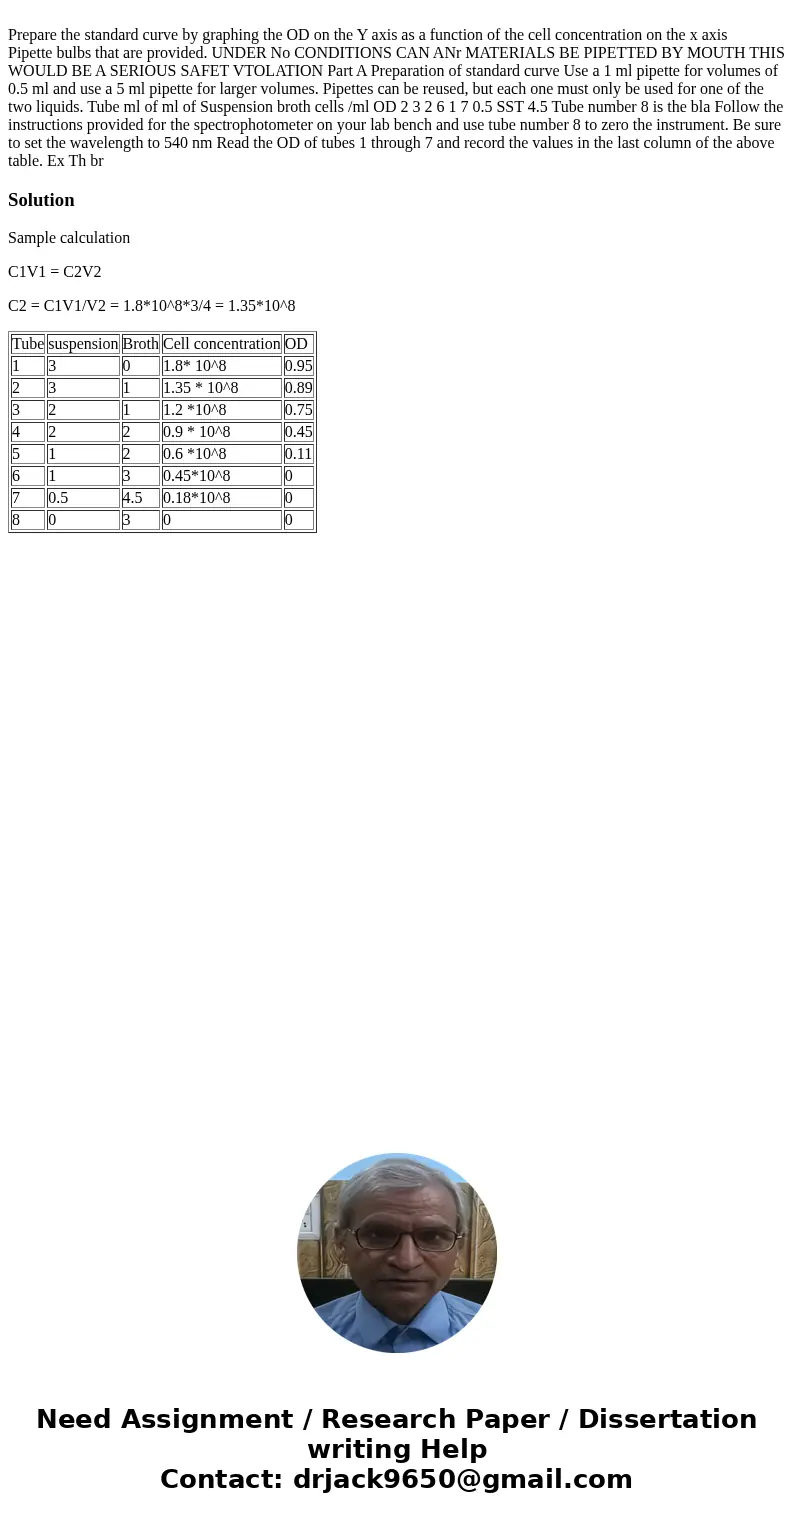
Prepare the standard curve by graphing the OD on the Y axis
Prepare the standard curve by graphing the OD on the Y axis as a function of the cell concentration on the x axis
Pipette bulbs that are provided. UNDER No CONDITIONS CAN ANr MATERIALS BE PIPETTED BY MOUTH THIS WOULD BE A SERIOUS SAFET VTOLATION Part A Preparation of standard curve Use a 1 ml pipette for volumes of 0.5 ml and use a 5 ml pipette for larger volumes. Pipettes can be reused, but each one must only be used for one of the two liquids. Tube ml of ml of Suspension broth cells /ml OD 2 3 2 6 1 7 0.5 SST 4.5 Tube number 8 is the bla Follow the instructions provided for the spectrophotometer on your lab bench and use tube number 8 to zero the instrument. Be sure to set the wavelength to 540 nm Read the OD of tubes 1 through 7 and record the values in the last column of the above table. Ex Th br Solution
Sample calculation
C1V1 = C2V2
C2 = C1V1/V2 = 1.8*10^8*3/4 = 1.35*10^8
| Tube | suspension | Broth | Cell concentration | OD |
| 1 | 3 | 0 | 1.8* 10^8 | 0.95 |
| 2 | 3 | 1 | 1.35 * 10^8 | 0.89 |
| 3 | 2 | 1 | 1.2 *10^8 | 0.75 |
| 4 | 2 | 2 | 0.9 * 10^8 | 0.45 |
| 5 | 1 | 2 | 0.6 *10^8 | 0.11 |
| 6 | 1 | 3 | 0.45*10^8 | 0 |
| 7 | 0.5 | 4.5 | 0.18*10^8 | 0 |
| 8 | 0 | 3 | 0 | 0 |

 Homework Sourse