This what i have so far loading libraries import numpy as np
This what i have so far
#loading libraries
import numpy as np
import csv
with open(\'energy.csv\', \'rb\') as csvfile:
lines = csv.reader(csvfile)
for row in lines:
print \', \'.join(row)
import csv
with open(\'energy.csv\', \'rb\') as csvfile:
lines = csv.reader(csvfile)
for row in lines:
print \', \'.join(row)
# define column names
names = [\'Countries\', \'Years\', \'Number of Countries\', \'Mean\', \'Small Production\',
\'Average Production\', \'Large Production\']
# create design matrix X and target vector y
X = np.array(df.ix[:, 0:4]) # end index is exclusive
y = np.array(df[\'Countries\']) # another way of indexing a pandas df
Assignment:
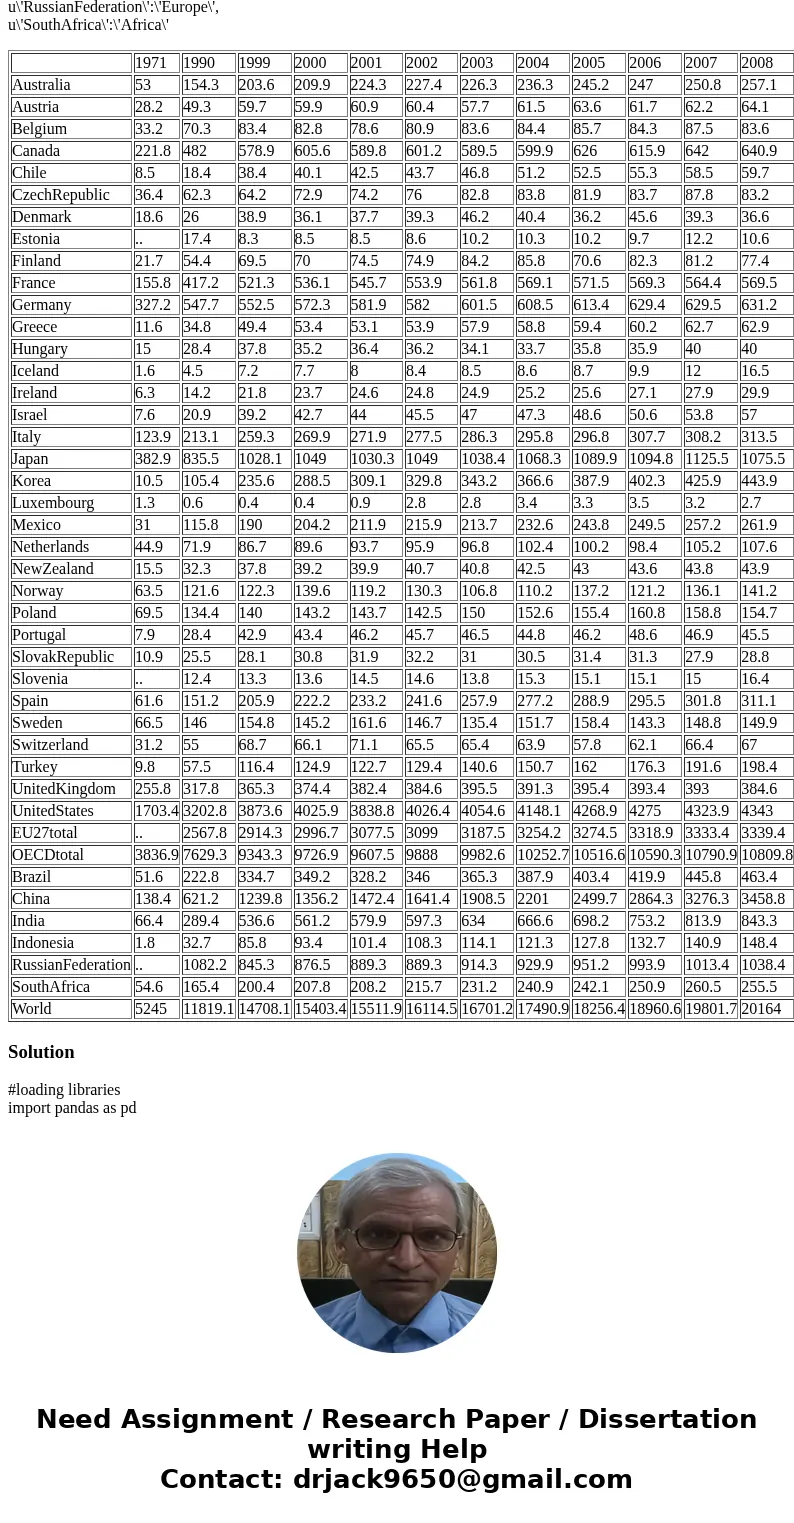
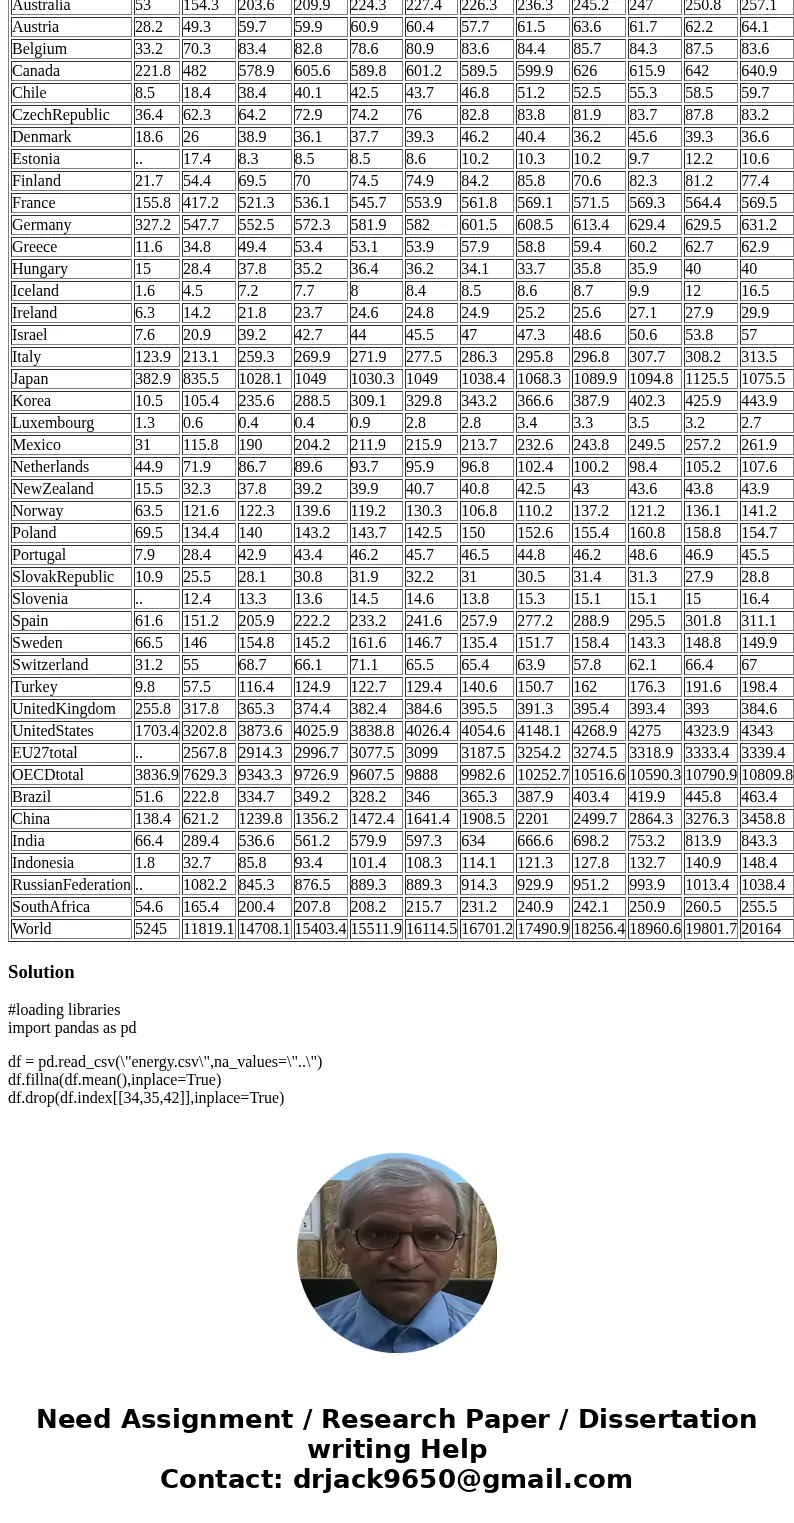
The file energy.csv contains the values of energy generated for each country in Terawatt Hours for different years(fromOECD Factbook 2011: Economic, Environmental and Social Statistics).
The data contains missing values (denoted by..) and also aggregate rows for the EU, OECD, and World countries.
Requirements
You are to create a program in Python that performs the following:
1.Loads the energy.csv file (assume it\'s in the current directory) and create a DataFrame object from it.
2.Replaces the missing values with the mean energy production for that country.
3.Removes the data for the aggregate values (EU27, OECD, World)
4.Adds a new column called \'Continent\' and fills it in with the continent that corresponds to each country.
5.Creates a DataFrame that contains the continent name as the index and the following columns:
a.\'num_countries\'=numberof countries for this continent
b.\'mean\'=mean energy production of the countries in this continent
c.\'small_production \' =1 if continent mean is less than the mean production of all countries minus one standard deviation; 0 otherwise
d.\'avg_production\' = 1 if continent mean is greater than the mean production of all countries minus one standard deviation , but less than the mean production of all countries plus one standard deviation; 0 otherwise
e.\'large_production\' = 1 if continent mean is greater than the mean production of all countries plus one standard deviation; 0 otherwise
6.Display the new DataFrame to the screen
1. The name of your source code file should be DataPrep.py. All your code should be withina single file.
2.You need to use the pandas DataFrame object for storing data.
3.Your code should follow good coding practices, including good useof whitespace and use of both inline and block comments.
4.You need to use meaningful identifier names that conform to standard naming conventions.
5.At the top of each file, you need to put in a block comment with the following information: your name,
date, course name, semester, and assignment name.
Data File: energy.csv
Continent Map?
u\'Australia\':\'Australia\',
u\'Austria\':\'Europe\',
u\'Belgium\':\'Europe\',
u\'Canada\':\'North America\',
u\'Chile\':\'South America\',
u\'CzechRepublic\':\'Europe\',
u\'Denmark\':\'Europe\',
u\'Estonia\':\'Europe\',
u\'Finland\':\'Europe\',
u\'France\':\'Europe\',
u\'Germany\':\'Europe\',
u\'Greece\':\'Europe\',
u\'Hungary\':\'Europe\',
u\'Iceland\':\'Europe\',
u\'Ireland\':\'Europe\',
u\'Israel\':\'Asia\',
u\'Italy\':\'Europe\',
u\'Japan\':\'Asia\',
u\'Korea\':\'Asia\',
u\'Luxembourg\':\'Europe\',
u\'Mexico\':\'North America\',
u\'Netherlands\':\'Europe\',
u\'NewZealand\':\'Oceania\',
u\'Norway\':\'Europe\',
u\'Poland\':\'Europe\',
u\'Portugal\':\'Europe\',
u\'SlovakRepublic\':\'Europe\',
u\'Slovenia\':\'Europe\',
u\'Spain\':\'Europe\',
u\'Sweden\':\'Europe\',
u\'Switzerland\':\'Europe\',
u\'Turkey\':\'Asia\',
u\'UnitedKingdom\':\'Europe\',
u\'UnitedStates\':\'North America\',
u\'Brazil\':\'South America\',
u\'China\':\'Asia\',
u\'India\':\'Asia\',
u\'Indonesia\':\'Asia\',
u\'RussianFederation\':\'Europe\',
u\'SouthAfrica\':\'Africa\'
| 1971 | 1990 | 1999 | 2000 | 2001 | 2002 | 2003 | 2004 | 2005 | 2006 | 2007 | 2008 | 2009 | 2010 | |
| Australia | 53 | 154.3 | 203.6 | 209.9 | 224.3 | 227.4 | 226.3 | 236.3 | 245.2 | 247 | 250.8 | 257.1 | 260.9 | 256.2 |
| Austria | 28.2 | 49.3 | 59.7 | 59.9 | 60.9 | 60.4 | 57.7 | 61.5 | 63.6 | 61.7 | 62.2 | 64.1 | 65.6 | 67 |
| Belgium | 33.2 | 70.3 | 83.4 | 82.8 | 78.6 | 80.9 | 83.6 | 84.4 | 85.7 | 84.3 | 87.5 | 83.6 | 89.8 | 95.1 |
| Canada | 221.8 | 482 | 578.9 | 605.6 | 589.8 | 601.2 | 589.5 | 599.9 | 626 | 615.9 | 642 | 640.9 | 603.1 | 598 |
| Chile | 8.5 | 18.4 | 38.4 | 40.1 | 42.5 | 43.7 | 46.8 | 51.2 | 52.5 | 55.3 | 58.5 | 59.7 | 60.7 | 62.5 |
| CzechRepublic | 36.4 | 62.3 | 64.2 | 72.9 | 74.2 | 76 | 82.8 | 83.8 | 81.9 | 83.7 | 87.8 | 83.2 | 81.7 | 85.3 |
| Denmark | 18.6 | 26 | 38.9 | 36.1 | 37.7 | 39.3 | 46.2 | 40.4 | 36.2 | 45.6 | 39.3 | 36.6 | 36.4 | 38.6 |
| Estonia | .. | 17.4 | 8.3 | 8.5 | 8.5 | 8.6 | 10.2 | 10.3 | 10.2 | 9.7 | 12.2 | 10.6 | 8.8 | 13 |
| Finland | 21.7 | 54.4 | 69.5 | 70 | 74.5 | 74.9 | 84.2 | 85.8 | 70.6 | 82.3 | 81.2 | 77.4 | 72.1 | 80.4 |
| France | 155.8 | 417.2 | 521.3 | 536.1 | 545.7 | 553.9 | 561.8 | 569.1 | 571.5 | 569.3 | 564.4 | 569.5 | 537.4 | 567.6 |
| Germany | 327.2 | 547.7 | 552.5 | 572.3 | 581.9 | 582 | 601.5 | 608.5 | 613.4 | 629.4 | 629.5 | 631.2 | 586.4 | 614.1 |
| Greece | 11.6 | 34.8 | 49.4 | 53.4 | 53.1 | 53.9 | 57.9 | 58.8 | 59.4 | 60.2 | 62.7 | 62.9 | 61.1 | 60.8 |
| Hungary | 15 | 28.4 | 37.8 | 35.2 | 36.4 | 36.2 | 34.1 | 33.7 | 35.8 | 35.9 | 40 | 40 | 35.9 | 37.4 |
| Iceland | 1.6 | 4.5 | 7.2 | 7.7 | 8 | 8.4 | 8.5 | 8.6 | 8.7 | 9.9 | 12 | 16.5 | 16.8 | 17.1 |
| Ireland | 6.3 | 14.2 | 21.8 | 23.7 | 24.6 | 24.8 | 24.9 | 25.2 | 25.6 | 27.1 | 27.9 | 29.9 | 27.9 | 28.3 |
| Israel | 7.6 | 20.9 | 39.2 | 42.7 | 44 | 45.5 | 47 | 47.3 | 48.6 | 50.6 | 53.8 | 57 | 55 | 57.2 |
| Italy | 123.9 | 213.1 | 259.3 | 269.9 | 271.9 | 277.5 | 286.3 | 295.8 | 296.8 | 307.7 | 308.2 | 313.5 | 288.3 | 295 |
| Japan | 382.9 | 835.5 | 1028.1 | 1049 | 1030.3 | 1049 | 1038.4 | 1068.3 | 1089.9 | 1094.8 | 1125.5 | 1075.5 | 1041 | 1071.3 |
| Korea | 10.5 | 105.4 | 235.6 | 288.5 | 309.1 | 329.8 | 343.2 | 366.6 | 387.9 | 402.3 | 425.9 | 443.9 | 451.7 | 478 |
| Luxembourg | 1.3 | 0.6 | 0.4 | 0.4 | 0.9 | 2.8 | 2.8 | 3.4 | 3.3 | 3.5 | 3.2 | 2.7 | 3.2 | 3.2 |
| Mexico | 31 | 115.8 | 190 | 204.2 | 211.9 | 215.9 | 213.7 | 232.6 | 243.8 | 249.5 | 257.2 | 261.9 | 261 | 268.4 |
| Netherlands | 44.9 | 71.9 | 86.7 | 89.6 | 93.7 | 95.9 | 96.8 | 102.4 | 100.2 | 98.4 | 105.2 | 107.6 | 113.5 | 114.7 |
| NewZealand | 15.5 | 32.3 | 37.8 | 39.2 | 39.9 | 40.7 | 40.8 | 42.5 | 43 | 43.6 | 43.8 | 43.9 | 43.5 | 44.8 |
| Norway | 63.5 | 121.6 | 122.3 | 139.6 | 119.2 | 130.3 | 106.8 | 110.2 | 137.2 | 121.2 | 136.1 | 141.2 | 132 | 124.1 |
| Poland | 69.5 | 134.4 | 140 | 143.2 | 143.7 | 142.5 | 150 | 152.6 | 155.4 | 160.8 | 158.8 | 154.7 | 151.1 | 157 |
| Portugal | 7.9 | 28.4 | 42.9 | 43.4 | 46.2 | 45.7 | 46.5 | 44.8 | 46.2 | 48.6 | 46.9 | 45.5 | 49.5 | 52.7 |
| SlovakRepublic | 10.9 | 25.5 | 28.1 | 30.8 | 31.9 | 32.2 | 31 | 30.5 | 31.4 | 31.3 | 27.9 | 28.8 | 25.9 | 27.3 |
| Slovenia | .. | 12.4 | 13.3 | 13.6 | 14.5 | 14.6 | 13.8 | 15.3 | 15.1 | 15.1 | 15 | 16.4 | 16.4 | 16.2 |
| Spain | 61.6 | 151.2 | 205.9 | 222.2 | 233.2 | 241.6 | 257.9 | 277.2 | 288.9 | 295.5 | 301.8 | 311.1 | 291 | 295.3 |
| Sweden | 66.5 | 146 | 154.8 | 145.2 | 161.6 | 146.7 | 135.4 | 151.7 | 158.4 | 143.3 | 148.8 | 149.9 | 136.6 | 152.8 |
| Switzerland | 31.2 | 55 | 68.7 | 66.1 | 71.1 | 65.5 | 65.4 | 63.9 | 57.8 | 62.1 | 66.4 | 67 | 66.7 | 66.6 |
| Turkey | 9.8 | 57.5 | 116.4 | 124.9 | 122.7 | 129.4 | 140.6 | 150.7 | 162 | 176.3 | 191.6 | 198.4 | 194.8 | 211.2 |
| UnitedKingdom | 255.8 | 317.8 | 365.3 | 374.4 | 382.4 | 384.6 | 395.5 | 391.3 | 395.4 | 393.4 | 393 | 384.6 | 372 | 378.1 |
| UnitedStates | 1703.4 | 3202.8 | 3873.6 | 4025.9 | 3838.8 | 4026.4 | 4054.6 | 4148.1 | 4268.9 | 4275 | 4323.9 | 4343 | 4165.4 | 4337.1 |
| EU27total | .. | 2567.8 | 2914.3 | 2996.7 | 3077.5 | 3099 | 3187.5 | 3254.2 | 3274.5 | 3318.9 | 3333.4 | 3339.4 | 3178.3 | .. |
| OECDtotal | 3836.9 | 7629.3 | 9343.3 | 9726.9 | 9607.5 | 9888 | 9982.6 | 10252.7 | 10516.6 | 10590.3 | 10790.9 | 10809.8 | 10403.1 | 10772.2 |
| Brazil | 51.6 | 222.8 | 334.7 | 349.2 | 328.2 | 346 | 365.3 | 387.9 | 403.4 | 419.9 | 445.8 | 463.4 | 466.5 | .. |
| China | 138.4 | 621.2 | 1239.8 | 1356.2 | 1472.4 | 1641.4 | 1908.5 | 2201 | 2499.7 | 2864.3 | 3276.3 | 3458.8 | 3695.9 | .. |
| India | 66.4 | 289.4 | 536.6 | 561.2 | 579.9 | 597.3 | 634 | 666.6 | 698.2 | 753.2 | 813.9 | 843.3 | 899.4 | .. |
| Indonesia | 1.8 | 32.7 | 85.8 | 93.4 | 101.4 | 108.3 | 114.1 | 121.3 | 127.8 | 132.7 | 140.9 | 148.4 | 155.5 | .. |
| RussianFederation | .. | 1082.2 | 845.3 | 876.5 | 889.3 | 889.3 | 914.3 | 929.9 | 951.2 | 993.9 | 1013.4 | 1038.4 | 990 | .. |
| SouthAfrica | 54.6 | 165.4 | 200.4 | 207.8 | 208.2 | 215.7 | 231.2 | 240.9 | 242.1 | 250.9 | 260.5 | 255.5 | 246.8 | .. |
| World | 5245 | 11819.1 | 14708.1 | 15403.4 | 15511.9 | 16114.5 | 16701.2 | 17490.9 | 18256.4 | 18960.6 | 19801.7 | 20164 | 20052.8 | .. |
Solution
#loading libraries
import pandas as pd
df = pd.read_csv(\"energy.csv\",na_values=\"..\")
df.fillna(df.mean(),inplace=True)
df.drop(df.index[[34,35,42]],inplace=True)


 Homework Sourse