Complete the table by continuing the pattern Then use the ta
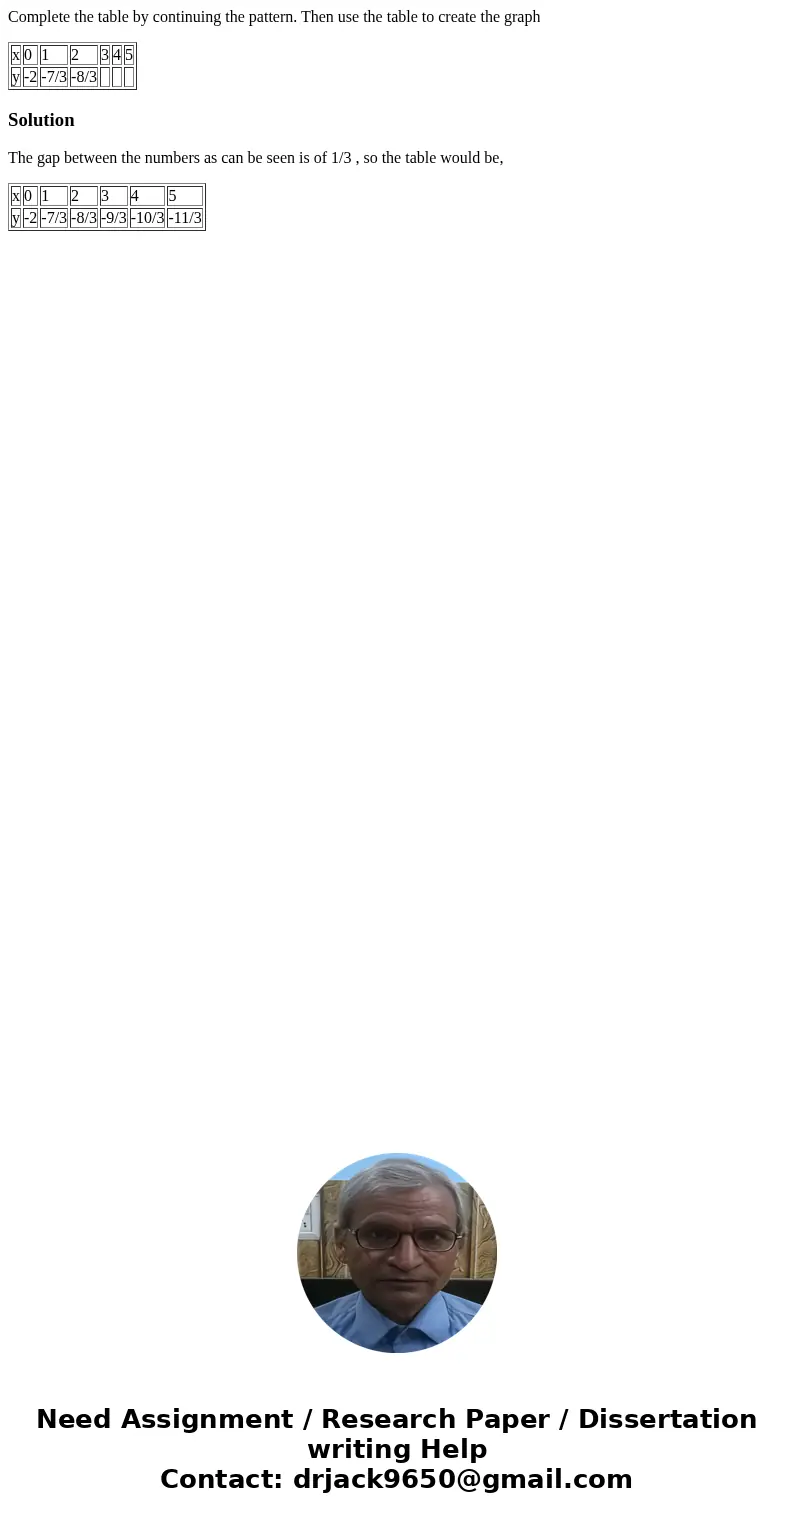
Complete the table by continuing the pattern. Then use the table to create the graph
| x | 0 | 1 | 2 | 3 | 4 | 5 |
| y | -2 | -7/3 | -8/3 |
Solution
The gap between the numbers as can be seen is of 1/3 , so the table would be,
| x | 0 | 1 | 2 | 3 | 4 | 5 |
| y | -2 | -7/3 | -8/3 | -9/3 | -10/3 | -11/3 |

 Homework Sourse