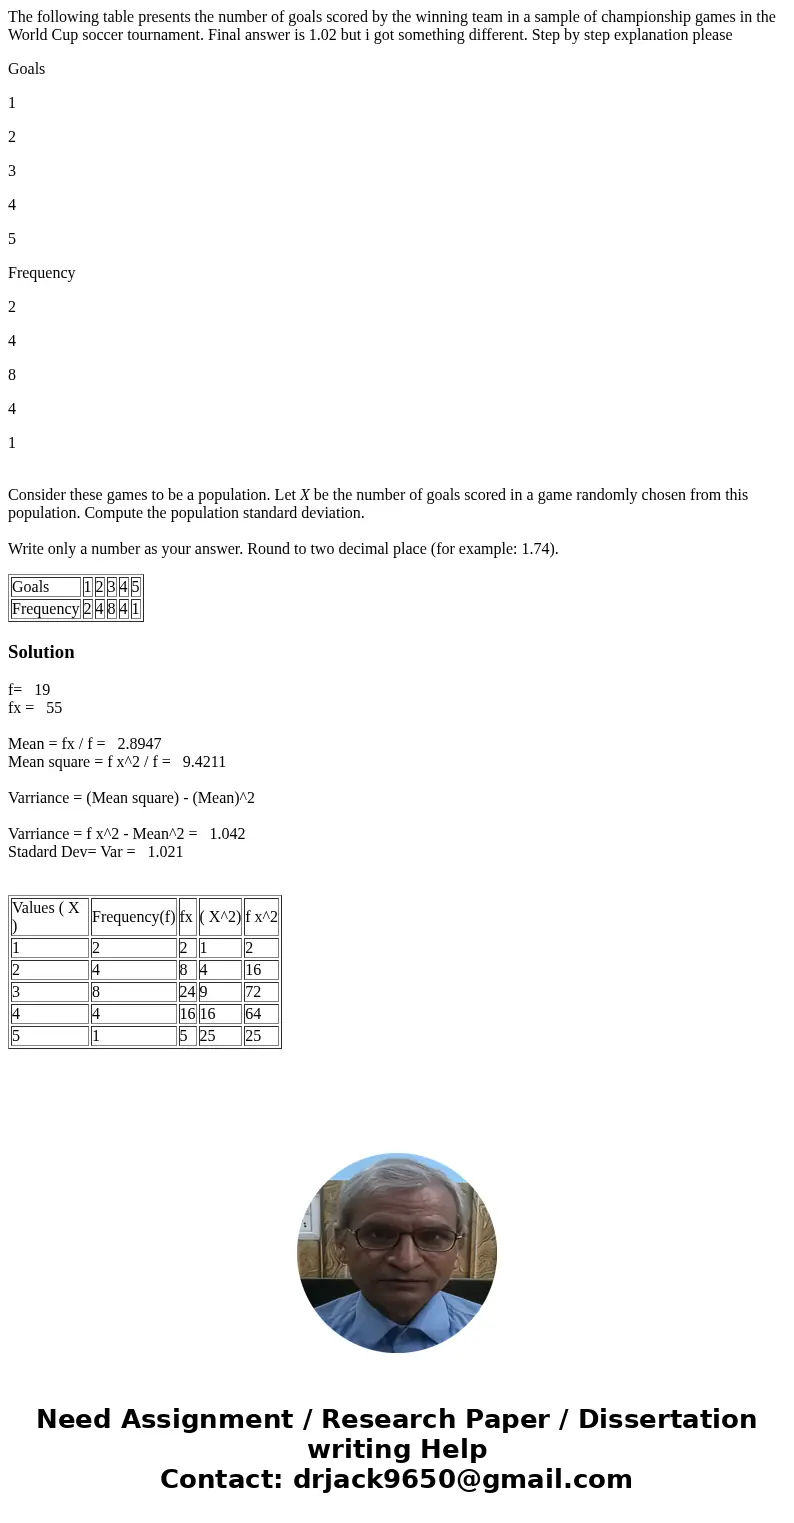
The following table presents the number of goals scored by t
The following table presents the number of goals scored by the winning team in a sample of championship games in the World Cup soccer tournament. Final answer is 1.02 but i got something different. Step by step explanation please
Goals
1
2
3
4
5
Frequency
2
4
8
4
1
Consider these games to be a population. Let X be the number of goals scored in a game randomly chosen from this population. Compute the population standard deviation.
Write only a number as your answer. Round to two decimal place (for example: 1.74).
| Goals | 1 | 2 | 3 | 4 | 5 |
| Frequency | 2 | 4 | 8 | 4 | 1 |
Solution
f= 19
fx = 55
Mean = fx / f = 2.8947
Mean square = f x^2 / f = 9.4211
Varriance = (Mean square) - (Mean)^2
Varriance = f x^2 - Mean^2 = 1.042
Stadard Dev= Var = 1.021
| Values ( X ) | Frequency(f) | fx | ( X^2) | f x^2 |
| 1 | 2 | 2 | 1 | 2 |
| 2 | 4 | 8 | 4 | 16 |
| 3 | 8 | 24 | 9 | 72 |
| 4 | 4 | 16 | 16 | 64 |
| 5 | 1 | 5 | 25 | 25 |

 Homework Sourse