The manager of an automobile showroom studied the time spent
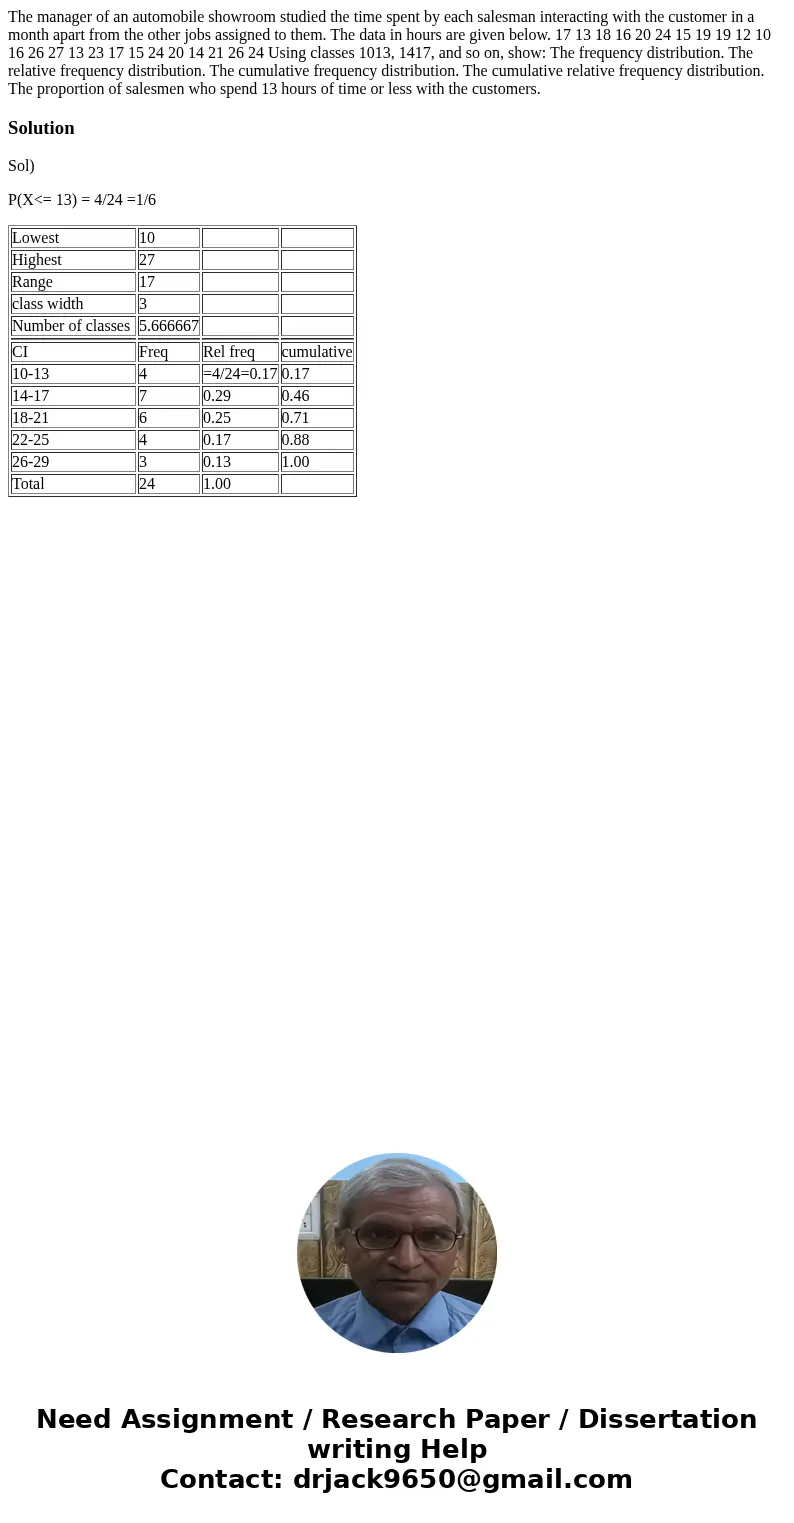
The manager of an automobile showroom studied the time spent by each salesman interacting with the customer in a month apart from the other jobs assigned to them. The data in hours are given below. 17 13 18 16 20 24 15 19 19 12 10 16 26 27 13 23 17 15 24 20 14 21 26 24 Using classes 1013, 1417, and so on, show: The frequency distribution. The relative frequency distribution. The cumulative frequency distribution. The cumulative relative frequency distribution. The proportion of salesmen who spend 13 hours of time or less with the customers.
Solution
Sol)
P(X<= 13) = 4/24 =1/6
| Lowest | 10 | ||
| Highest | 27 | ||
| Range | 17 | ||
| class width | 3 | ||
| Number of classes | 5.666667 | ||
| CI | Freq | Rel freq | cumulative |
| 10-13 | 4 | =4/24=0.17 | 0.17 |
| 14-17 | 7 | 0.29 | 0.46 |
| 18-21 | 6 | 0.25 | 0.71 |
| 22-25 | 4 | 0.17 | 0.88 |
| 26-29 | 3 | 0.13 | 1.00 |
| Total | 24 | 1.00 |

 Homework Sourse