The data file supermarketcsv contains data on the total amou
The data file \"supermarket.csv\" contains data on the total amount of eggs sold, relevant prices and advertising information at a supermarket.
1) Treating the data as linear, run a multivariate regression of total egg sales on the three other variables.
2) Perform a log-log transformation of the data (Achieved by taking the natural logarithm of all variables except ad type). Run a multivariate regression of log total egg sales on log egg prices and log cookie prices (discard the dummy variable for ad type).
3) Compare the Lerner index values from parts 1 and 2. In your opinion, which method is more accurate? Why?
4) Interpret the Lerner index you chose in part 3. What percentage of the supermarkets price is their prot margin.
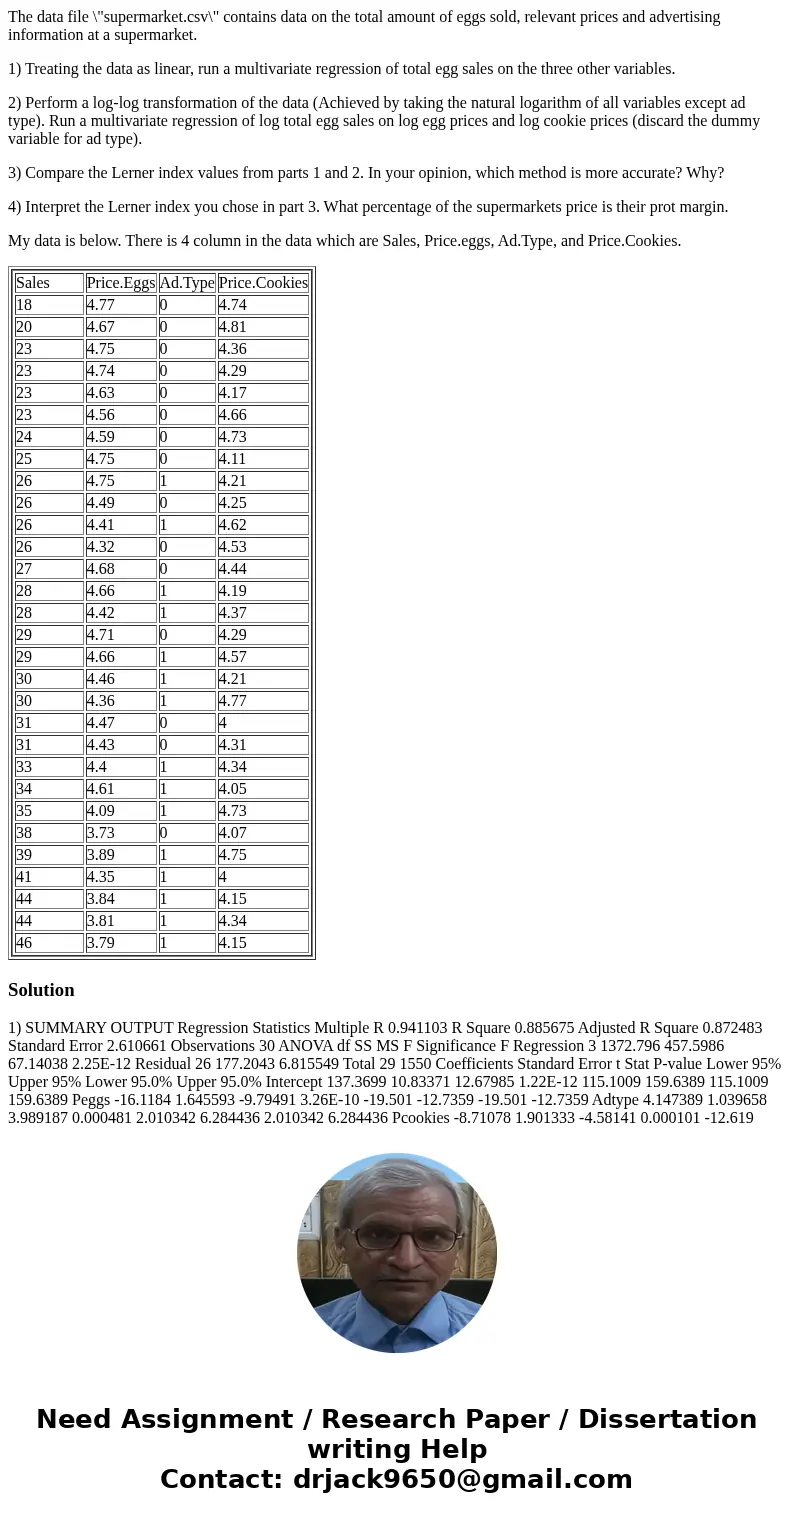
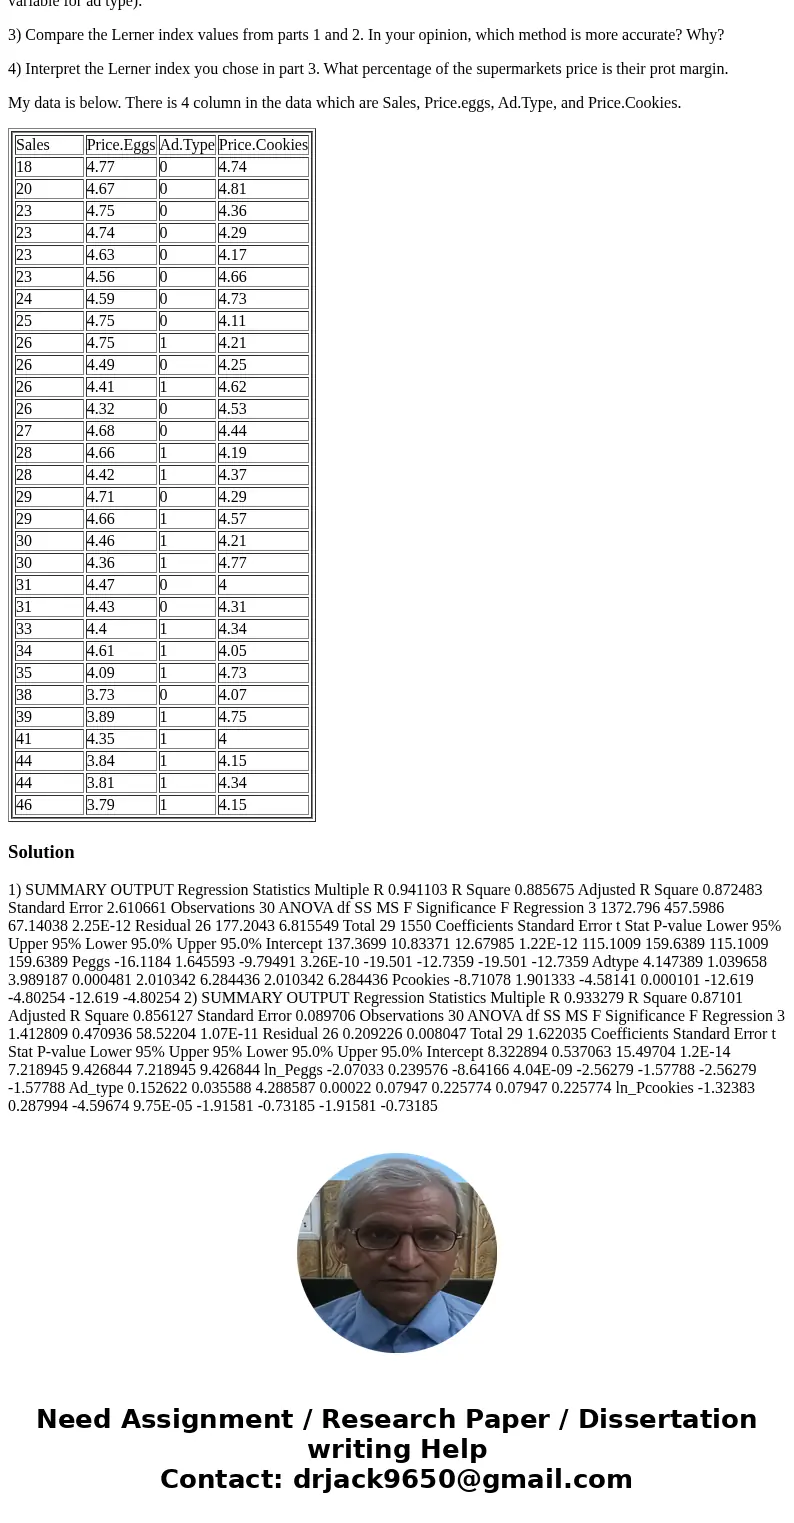
My data is below. There is 4 column in the data which are Sales, Price.eggs, Ad.Type, and Price.Cookies.
|
Solution
1) SUMMARY OUTPUT Regression Statistics Multiple R 0.941103 R Square 0.885675 Adjusted R Square 0.872483 Standard Error 2.610661 Observations 30 ANOVA df SS MS F Significance F Regression 3 1372.796 457.5986 67.14038 2.25E-12 Residual 26 177.2043 6.815549 Total 29 1550 Coefficients Standard Error t Stat P-value Lower 95% Upper 95% Lower 95.0% Upper 95.0% Intercept 137.3699 10.83371 12.67985 1.22E-12 115.1009 159.6389 115.1009 159.6389 Peggs -16.1184 1.645593 -9.79491 3.26E-10 -19.501 -12.7359 -19.501 -12.7359 Adtype 4.147389 1.039658 3.989187 0.000481 2.010342 6.284436 2.010342 6.284436 Pcookies -8.71078 1.901333 -4.58141 0.000101 -12.619 -4.80254 -12.619 -4.80254 2) SUMMARY OUTPUT Regression Statistics Multiple R 0.933279 R Square 0.87101 Adjusted R Square 0.856127 Standard Error 0.089706 Observations 30 ANOVA df SS MS F Significance F Regression 3 1.412809 0.470936 58.52204 1.07E-11 Residual 26 0.209226 0.008047 Total 29 1.622035 Coefficients Standard Error t Stat P-value Lower 95% Upper 95% Lower 95.0% Upper 95.0% Intercept 8.322894 0.537063 15.49704 1.2E-14 7.218945 9.426844 7.218945 9.426844 ln_Peggs -2.07033 0.239576 -8.64166 4.04E-09 -2.56279 -1.57788 -2.56279 -1.57788 Ad_type 0.152622 0.035588 4.288587 0.00022 0.07947 0.225774 0.07947 0.225774 ln_Pcookies -1.32383 0.287994 -4.59674 9.75E-05 -1.91581 -0.73185 -1.91581 -0.73185

 Homework Sourse