A bowlers scores for six games were 183 168 188 193 170 and
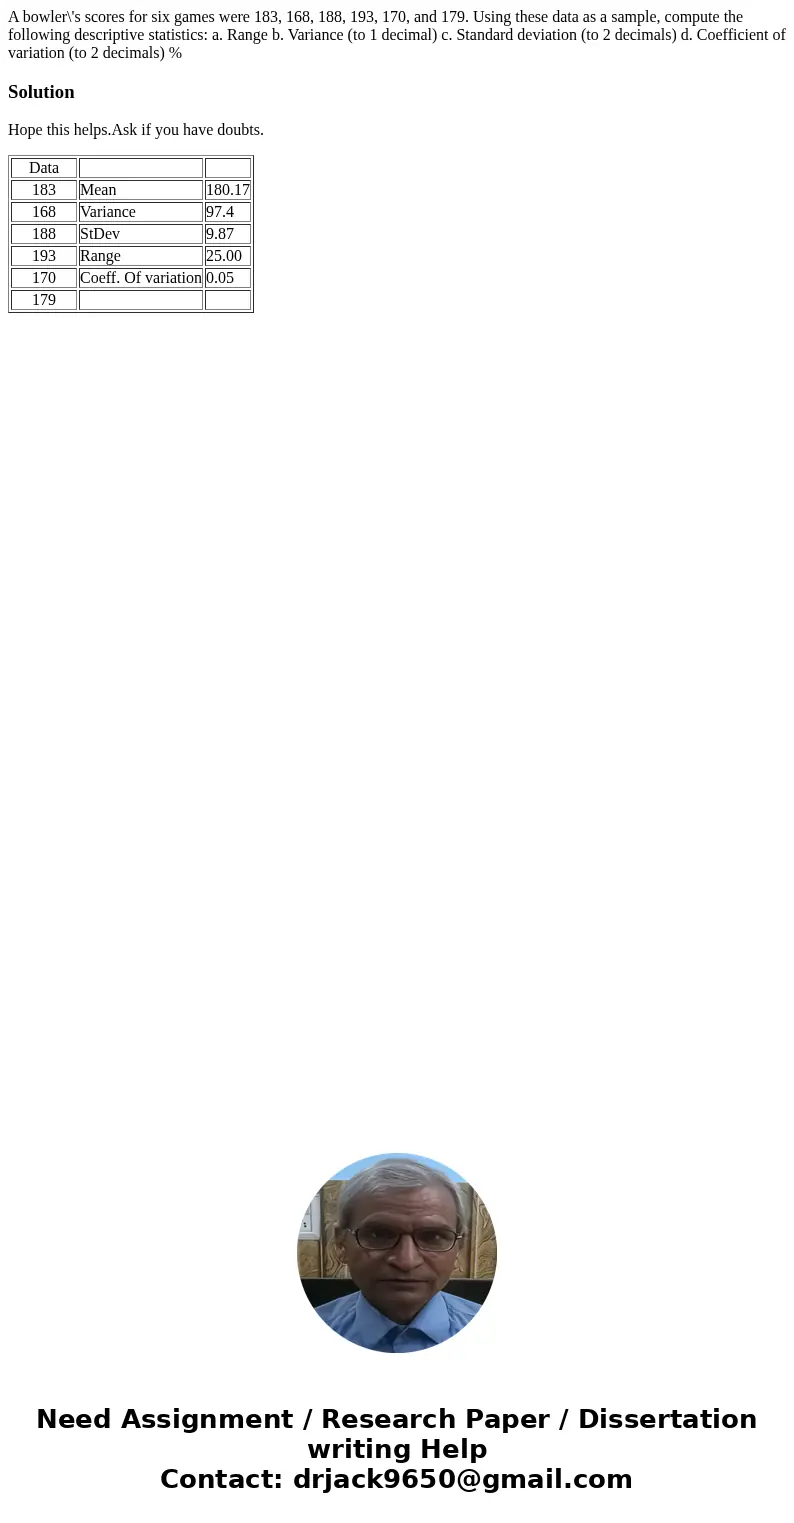
A bowler\'s scores for six games were 183, 168, 188, 193, 170, and 179. Using these data as a sample, compute the following descriptive statistics: a. Range b. Variance (to 1 decimal) c. Standard deviation (to 2 decimals) d. Coefficient of variation (to 2 decimals) %
Solution
Hope this helps.Ask if you have doubts.
| Data | ||
| 183 | Mean | 180.17 |
| 168 | Variance | 97.4 |
| 188 | StDev | 9.87 |
| 193 | Range | 25.00 |
| 170 | Coeff. Of variation | 0.05 |
| 179 |

 Homework Sourse