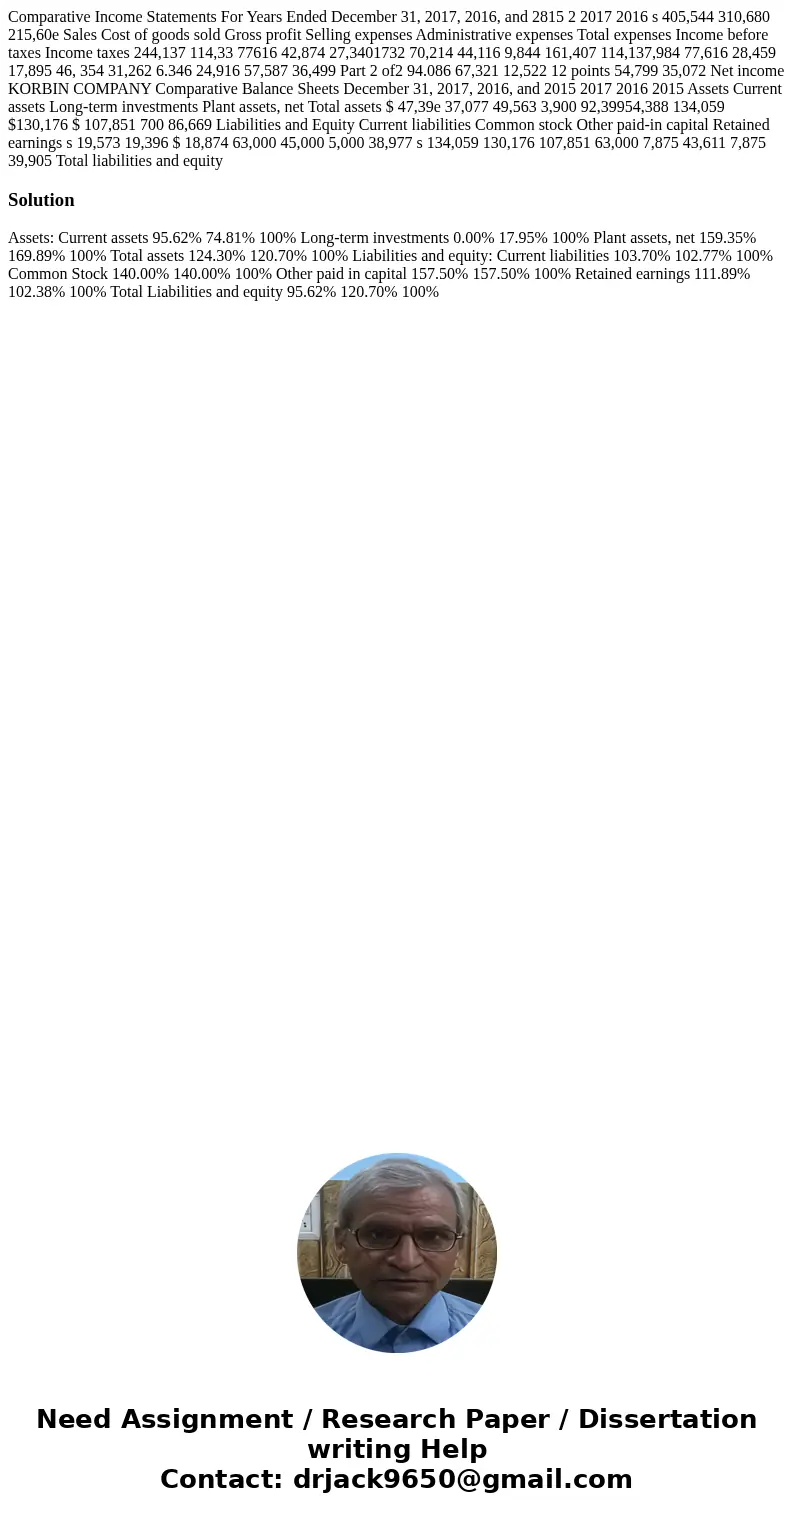
Comparative Income Statements For Years Ended December 31 20
Comparative Income Statements For Years Ended December 31, 2017, 2016, and 2815 2 2017 2016 s 405,544 310,680 215,60e Sales Cost of goods sold Gross profit Selling expenses Administrative expenses Total expenses Income before taxes Income taxes 244,137 114,33 77616 42,874 27,3401732 70,214 44,116 9,844 161,407 114,137,984 77,616 28,459 17,895 46, 354 31,262 6.346 24,916 57,587 36,499 Part 2 of2 94.086 67,321 12,522 12 points 54,799 35,072 Net income KORBIN COMPANY Comparative Balance Sheets December 31, 2017, 2016, and 2015 2017 2016 2015 Assets Current assets Long-term investments Plant assets, net Total assets $ 47,39e 37,077 49,563 3,900 92,39954,388 134,059 $130,176 $ 107,851 700 86,669 Liabilities and Equity Current liabilities Common stock Other paid-in capital Retained earnings s 19,573 19,396 $ 18,874 63,000 45,000 5,000 38,977 s 134,059 130,176 107,851 63,000 7,875 43,611 7,875 39,905 Total liabilities and equity 
Solution
Assets: Current assets 95.62% 74.81% 100% Long-term investments 0.00% 17.95% 100% Plant assets, net 159.35% 169.89% 100% Total assets 124.30% 120.70% 100% Liabilities and equity: Current liabilities 103.70% 102.77% 100% Common Stock 140.00% 140.00% 100% Other paid in capital 157.50% 157.50% 100% Retained earnings 111.89% 102.38% 100% Total Liabilities and equity 95.62% 120.70% 100%
 Homework Sourse