The Federal Election Commission maintains data showing the v
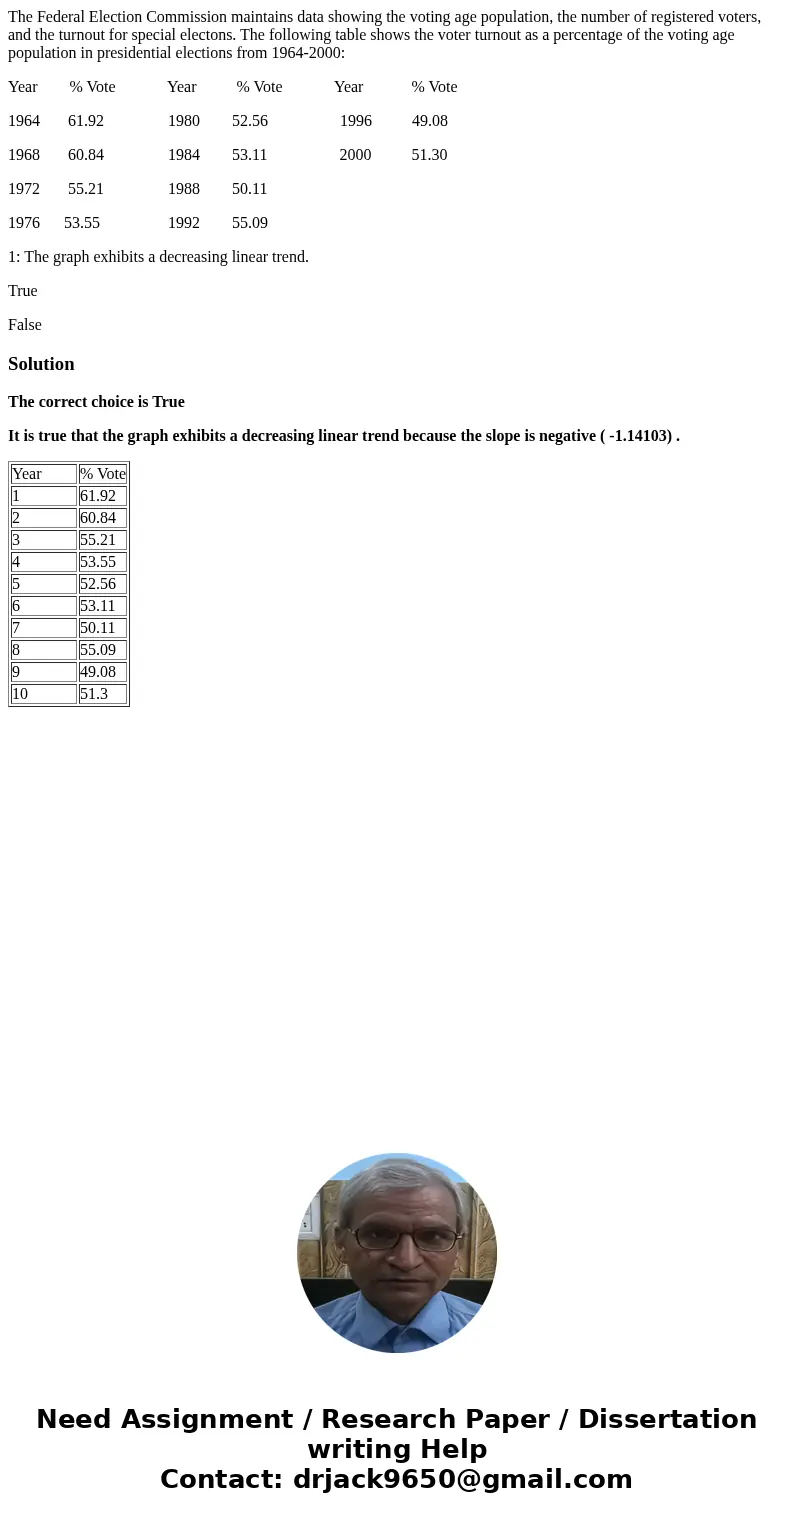
The Federal Election Commission maintains data showing the voting age population, the number of registered voters, and the turnout for special electons. The following table shows the voter turnout as a percentage of the voting age population in presidential elections from 1964-2000:
Year % Vote Year % Vote Year % Vote
1964 61.92 1980 52.56 1996 49.08
1968 60.84 1984 53.11 2000 51.30
1972 55.21 1988 50.11
1976 53.55 1992 55.09
1: The graph exhibits a decreasing linear trend.
True
False
Solution
The correct choice is True
It is true that the graph exhibits a decreasing linear trend because the slope is negative ( -1.14103) .
| Year | % Vote |
| 1 | 61.92 |
| 2 | 60.84 |
| 3 | 55.21 |
| 4 | 53.55 |
| 5 | 52.56 |
| 6 | 53.11 |
| 7 | 50.11 |
| 8 | 55.09 |
| 9 | 49.08 |
| 10 | 51.3 |

 Homework Sourse