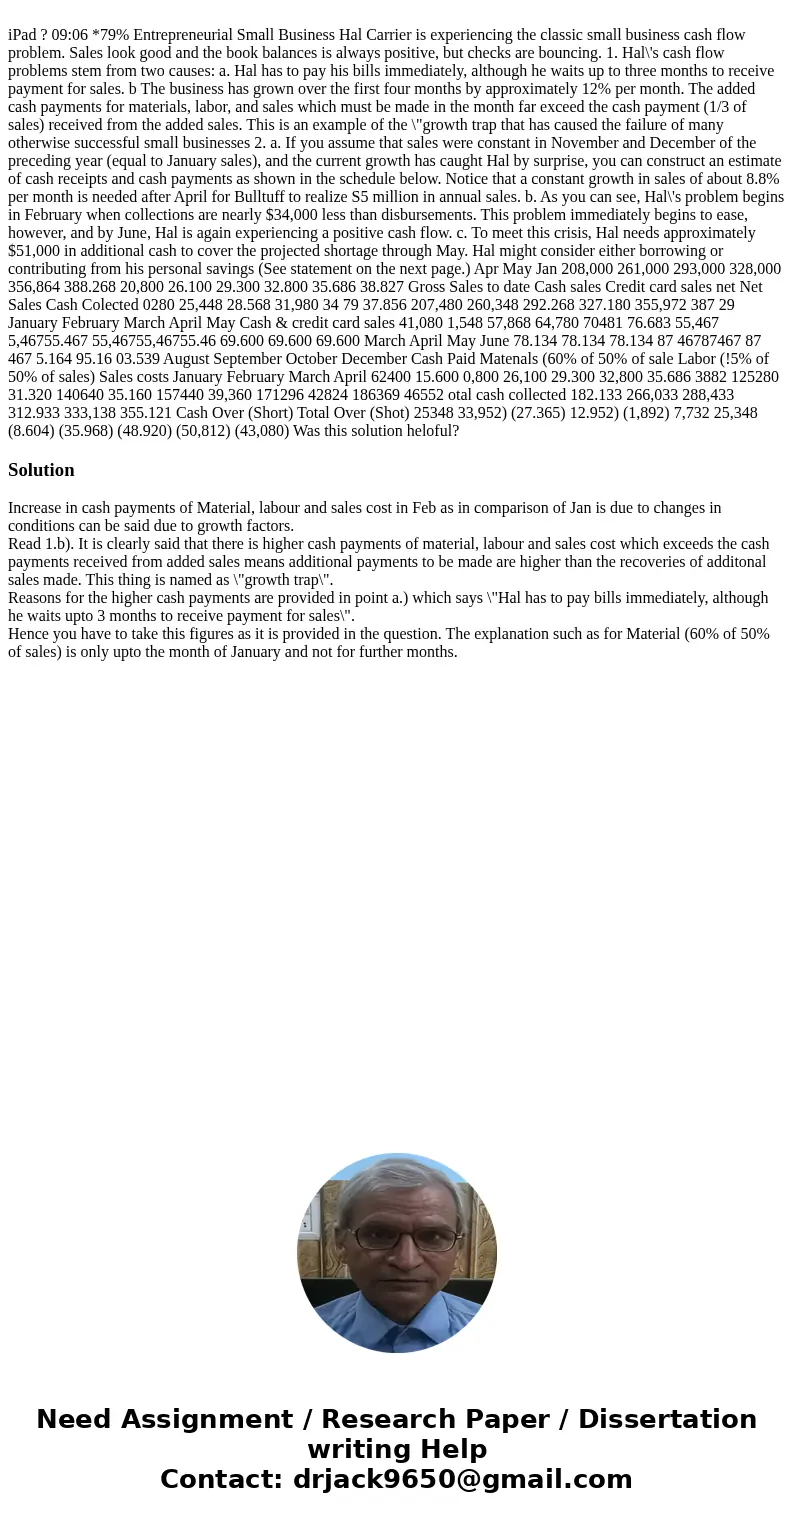
iPad ? 09:06 *79% Entrepreneurial Small Business Hal Carrier is experiencing the classic small business cash flow problem. Sales look good and the book balances is always positive, but checks are bouncing. 1. Hal\'s cash flow problems stem from two causes: a. Hal has to pay his bills immediately, although he waits up to three months to receive payment for sales. b The business has grown over the first four months by approximately 12% per month. The added cash payments for materials, labor, and sales which must be made in the month far exceed the cash payment (1/3 of sales) received from the added sales. This is an example of the \"growth trap that has caused the failure of many otherwise successful small businesses 2. a. If you assume that sales were constant in November and December of the preceding year (equal to January sales), and the current growth has caught Hal by surprise, you can construct an estimate of cash receipts and cash payments as shown in the schedule below. Notice that a constant growth in sales of about 8.8% per month is needed after April for Bulltuff to realize S5 million in annual sales. b. As you can see, Hal\'s problem begins in February when collections are nearly $34,000 less than disbursements. This problem immediately begins to ease, however, and by June, Hal is again experiencing a positive cash flow. c. To meet this crisis, Hal needs approximately $51,000 in additional cash to cover the projected shortage through May. Hal might consider either borrowing or contributing from his personal savings (See statement on the next page.) Apr May Jan 208,000 261,000 293,000 328,000 356,864 388.268 20,800 26.100 29.300 32.800 35.686 38.827 Gross Sales to date Cash sales Credit card sales net Net Sales Cash Colected 0280 25,448 28.568 31,980 34 79 37.856 207,480 260,348 292.268 327.180 355,972 387 29 January February March April May Cash & credit card sales 41,080 1,548 57,868 64,780 70481 76.683 55,467 5,46755.467 55,46755,46755.46 69.600 69.600 69.600 March April May June 78.134 78.134 78.134 87 46787467 87 467 5.164 95.16 03.539 August September October December Cash Paid Matenals (60% of 50% of sale Labor (!5% of 50% of sales) Sales costs January February March April 62400 15.600 0,800 26,100 29.300 32,800 35.686 3882 125280 31.320 140640 35.160 157440 39,360 171296 42824 186369 46552 otal cash collected 182.133 266,033 288,433 312.933 333,138 355.121 Cash Over (Short) Total Over (Shot) 25348 33,952) (27.365) 12.952) (1,892) 7,732 25,348 (8.604) (35.968) (48.920) (50,812) (43,080) Was this solution heloful?
Increase in cash payments of Material, labour and sales cost in Feb as in comparison of Jan is due to changes in conditions can be said due to growth factors.
Read 1.b). It is clearly said that there is higher cash payments of material, labour and sales cost which exceeds the cash payments received from added sales means additional payments to be made are higher than the recoveries of additonal sales made. This thing is named as \"growth trap\".
Reasons for the higher cash payments are provided in point a.) which says \"Hal has to pay bills immediately, although he waits upto 3 months to receive payment for sales\".
Hence you have to take this figures as it is provided in the question. The explanation such as for Material (60% of 50% of sales) is only upto the month of January and not for further months.

 Homework Sourse